Overview of raw data in NetFlow Analyzer
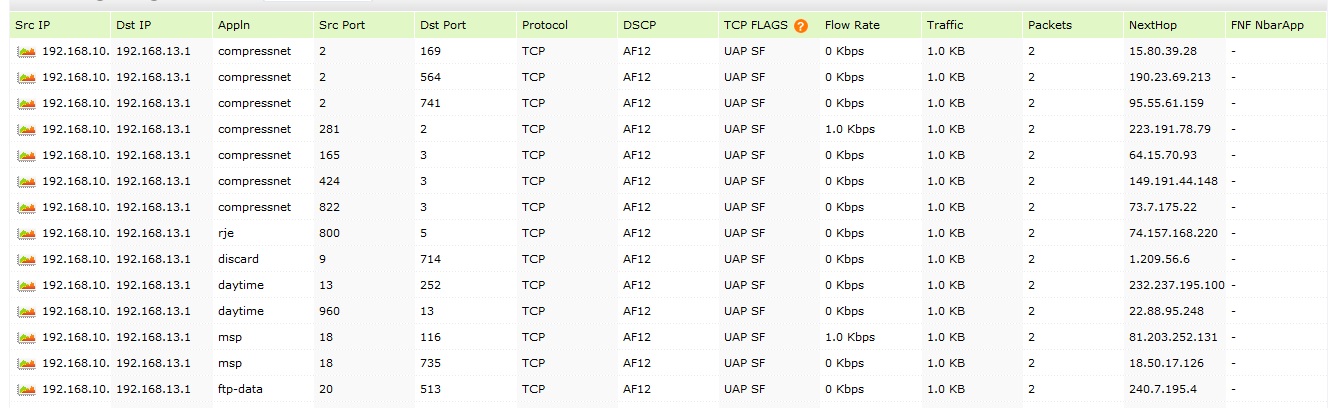
NetFlow Analyzer stores two types of data: raw and aggregate. Raw data pertains to flow information that has been exported from devices. This includes information such as TCP flags, the number of packets, and the next hop IP along with the port, protocol, and IP addresses used.
Aggregate data pertains to the top 100 flows (all fields in NetFlow data exported) based on the bytes for every interface for every 10-minute interval. Older data is repeatedly rolled up into less granular intervals (10 minutes, one hour, six hours, daily, and weekly).
Raw data consumes a huge amount of disk space because it contains so much flow information. You can store raw data based on the flow rate and the disk space available in your server. By default, it is set to be stored for a maximum of 30 days. To make it simple, NetFlow Analyzer itself displays the flow rate and how long you can store raw data. You can view this information by navigating to Admin > Raw data settings as shown below:
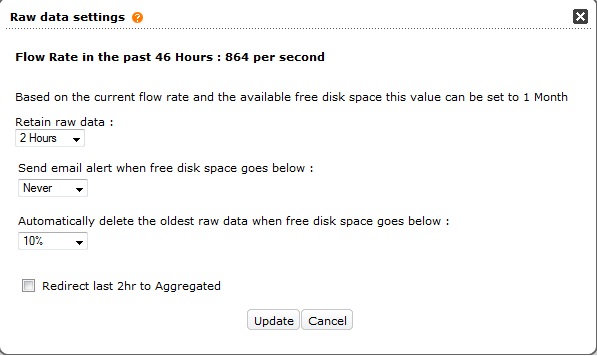 You can also configure NetFlow Analyzer to trigger an alert if the free disk space falls below a specified threshold and to automatically delete older raw data when disk space falls below a specified percentage.
Raw data is used when generating Troubleshooting reports and reports on recent data. The raw data has complete port-level information, which helps in detailed analysis of traffic.
Reports on recent data
In NetFlow Analyzer, when analyzing data from within the last two hours or less, information will be queried from raw data. From this selected period of time, you can click Show Data Points under the traffic tab to view the link utilization for each minute.
If you want to look at data for a specific minute, you can click the hyperlink available for that time period. This will display all the conversations that happened during that minute. You can export the information in PDF or CSV formats, or you can email the report.
Note: The hyperlink will not be available if it exceeds the raw data storage time period.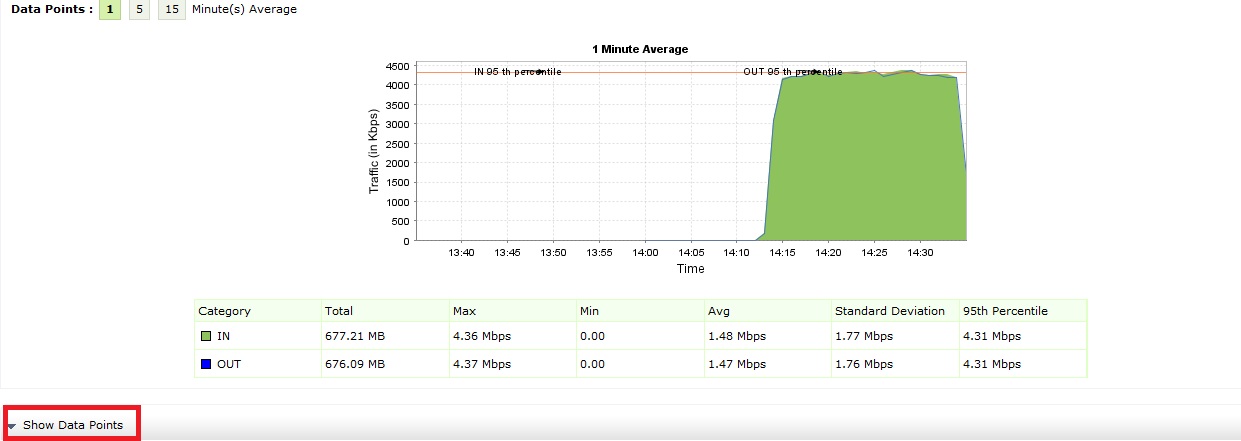
Troubleshooting report
To generate a Troubleshooting report, select an interface and click More Reports > Troubleshooting report.To find the amount of data transferred between two hosts for a selected period of time, you can add criteria, specify the IP addresses, and select Match all the following. This will display every conversation that happened between the two hosts. You can also add a port or an application to find out the information passed between them.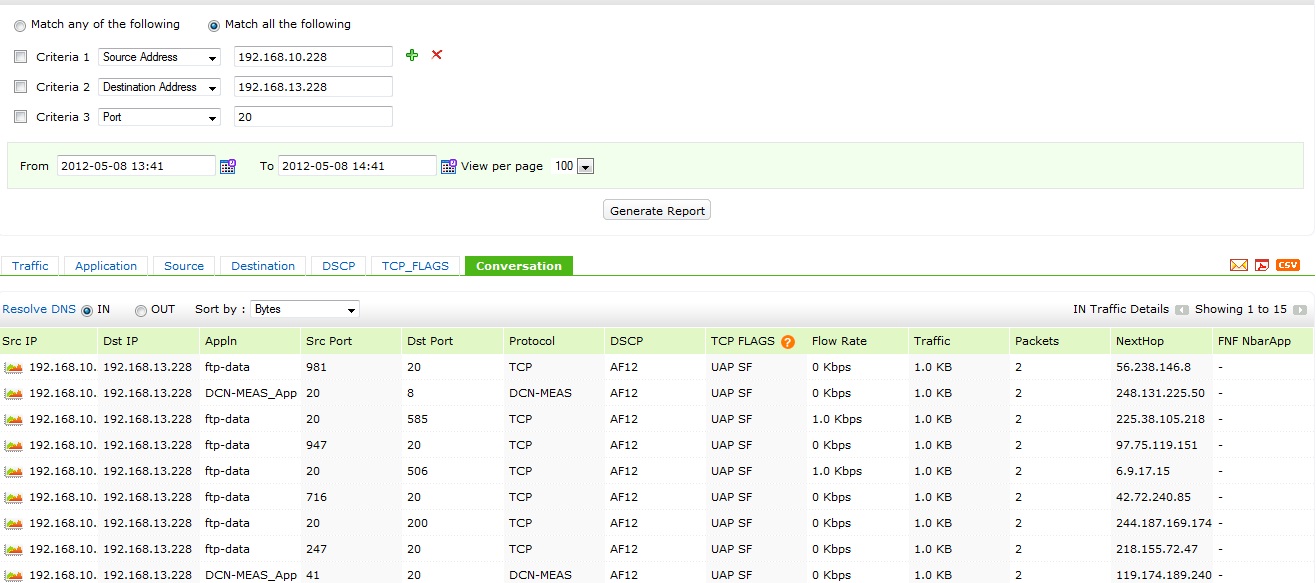 Download | Interactive demo | Customers