Cisco WAAS Reporting in NetFlow Analyzer---Part 2
So after adding WAAS to your NetFlow Analyzer, next question is what kind of reports it can generate? This blog helps you to understand various kind of reports available in Cisco WAAS module. Once the Central Manager is added to NetFlow Analyzer, you can see Central Manager related details under Modules --> Cisco WAAS.
Central Manager Report:
You can view the reports based on hourly, daily, weekly, monthly using 'Custom Reports'. The Accelerator Group gives you the list of WAAS Accelerator Engines grouped together for easy identification purposes. You can also view their reduction percentage, status, and a brief description about the group.
You can also view the top 10 WAE's by compression percentage as a pie chart. The report displays WAN, LAN and compressed Traffic along with the reduction percentage.

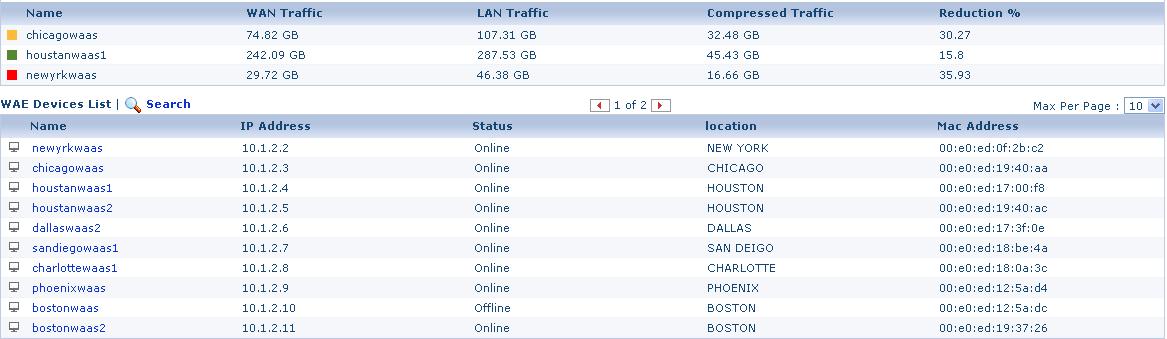
WAE Reports:
WAE reports can be accessed by clicking on each WAE device list on the 'Modules' page. The WAE reports page gives you detailed statistics of every device associated with a specific Central Manager. This Report details you on:
Application Reduction: The amount of compression done for each mapped application. By clicking on the application name you can view reports showing bandwidth reduction by location, bandwidth optimization trend and pass through summary trend of the specific Application.

Bandwidth Reduction by Location: This details on the WAN, LAN, and amount of traffic compression for each application along with the increase in bandwidth capacity due to compression.

Pass Through Summary Trend: The unoptimized traffic that passes through the WAE. You can view graph based on peer traffic, intermediate traffic,overload traffic and policy applied.
WAE Device Connection Statistics:
Lists the conversations that passed through the selected WAE device and their corresponding statistics. Using this you can view the source, destination of the conversation, their respective ports, type of policy applied, and the duration of each conversation. You can also view the type of policy applied, the initial amount of traffic and compressed traffic in bytes along with the compression ratio.
Various Report in WAAS:
To compare the WAAS stats with the NetFlow router stats, you would first need to map the router to peering WAE. You can map the router to corresponding WAE under Product Settings----> WAAS settings.
You can find the WAAS reports of each router in the index page of the NetFlow Analyzer. Here, the routers that are mapped to a specific WAE along with router's IP address, peer WAE volume of LAN, WAN traffic and its reduction percentage can be viewed. Click on the router name to view the detailed statistics optimized traffic, application, and connections of the router selected.

Optimized Traffic: This shows the percentage of traffic that is WAN and LAN traffic in the specified time period. The WAN traffic represents optimized traffic whereas LAN traffic denotes unoptimized traffic.
Optimized Application: < /b>This shows the NetFlow Application Traffic for the mapped WAE application in the selected time period. Click on the application to view the graphical representation of traffic against time.


Download the 30 day trial from here.
Praveen Kumar
NetFlow Analyzer Technical Team
Download | Interactive Demo | Twitter | Customers