Amazon Web Services (AWS) is a popular cloud platform known for its scalability, flexibility, and cost-efficiency. However, its dynamic nature and its complex architecture make real-time monitoring a challenge without a dedicated AWS monitoring tool. IT teams that operate in the AWS cloud need to keep an eye on every corner of the cloud infrastructure to ensure smooth IT operations. Adopting an AWS performance monitoring solution to track and analyze AWS cloud performance helps admins understand the behavior of business-critical elements and optimize cloud efficiency to level up with end-user demands.
In this blog post, we’ll take a look at the common challenges in monitoring AWS environments and how ManageEngine Applications Manager can help overcome these challenges.
Common challenges in AWS cloud monitoring
Most IT teams find it hard to understand their AWS cloud performance at a granular level, given the layered and dynamic architecture. Multiple interdependent instances and siloed components make it difficult for the admins to deep-dive into their cloud environment and visualize the performance of critical components. Here are a few such challenges that are commonly faced by IT administrators while monitoring the AWS cloud.
Dynamic architecture
AWS environments can scale up or down dynamically. Resources like EC2 instances, containers, and serverless functions are frequently created, scaled, and terminated based on demand. This makes it difficult to gain a comprehensive view of the entire environment in real time. Also, the interdependent nature of microservices and distributed systems increases the difficulty in identifying performance bottlenecks and locating causes of issues, which can only be compensated with advanced monitoring solutions that can dive deep into your AWS cloud and scale to the needs of your dynamic cloud infrastructure.
Extensive cloud data
Typical AWS services process numerous data requests and support heavy operations. This load grows with the size of the AWS ecosystem. Tracking such data and understanding the behavior of those operations as the infrastructure up-scales becomes a tedious task for the admin teams. This primarily affects visibility, and partial visibility can lead to delays in locating performance bottlenecks or potential downtime. As the ecosystem expands, tackling these challenges requires advanced strategies to ensure smooth operations across your AWS services.
Difficulty in real-time performance analysis
Monitoring AWS resources in real time is crucial, but can be challenging, especially with the vast amount of data generated. For example, if you’re monitoring an Amazon Kinesis data stream, you’ll need to process and analyze the data in real time to identify issues and take corrective action.
The dynamic nature of cloud resources complicates the tracking of interactions and dependencies. For example, a slowdown in Amazon EC2 might be linked to underlying issues in Elastic Load Balancer or a misconfigured security group. Admins often need to correlate metrics, logs, traces, and events from different AWS services to troubleshoot the issue, making it tedious and error-prone. This might lead to significant delays in locating and resolving issues in time, before severe incidents—like server slowdowns, resource starvation, workload imbalance, crashes, etc.—affect end-user experience and overall cloud performance.
Without a dedicated tool to identify performance anomalies, streamline alerts, and define priority, frequent alarms from multiple services can lead to alert fatigue, which potentially affects issue-fixes and takes a toll on user experience.
Resource management
In larger organizations, keeping track of all AWS resources becomes increasingly difficult. Users sometimes discover “zombie” resources that are no longer in use but continue to incur costs. Without proper tools, it can be challenging to fine-tune resource allocation and ensure efficient use of computing power, storage, and network resources.
Cost management
AWS pricing can be complex and difficult to manage without proper monitoring. For example, if you’re using Amazon EC2 instances, you’ll need to monitor your instance usage and adjust your instance types and sizes to optimize your costs. This can be difficult, as you need to balance your cost optimization efforts with your performance and availability requirements. Without careful monitoring, you risk overspending on resources you don’t need or aren’t using efficiently.
When using native tools like AWS CloudWatch for monitoring, the costs can escalate rapidly, especially when applications generate excessive logging data without proper rate limiting or cleanup mechanisms. There could be unexpected charges due to high log volumes, which can be difficult to manage effectively within AWS’s pricing structure. Additionally, the complexity of managing multiple metrics across different accounts or regions can lead to inefficiencies and increased costs due to overlapping data collection efforts.
Multiple monitoring interfaces
AWS doesn’t offer a centralized monitoring tool that can collect and analyze all data from all AWS services in one place. When each compartment of AWS’s cloud is monitored from a different native monitoring solution—like AWS CloudWatch or CloudTrail—it leaves the admin teams navigating numerous interfaces. This makes the analysis and correlation of the behavior of various components tedious, which are both necessary to optimize overall AWS performance. Such a decentralized monitoring system offers partial visibility, and could lead to severe delays in identifying performance anomalies and resolving critical issues.
Also, if your cloud ecosystem accommodates multiple cloud vendors like Azure and Google, native monitoring tools just don’t cut it for the rest of the infrastructure. This lack of unified monitoring across platforms opens doors to blind spots, blurring your visibility into your cloud infrastructure. Additionally, cloud migration challenges—like bulk-data transfer, application reconfiguration, and integration issues—can further complicate monitoring and cause inaccuracies in identification of critical cloud performance issues. Adopting centralized, cross-platform monitoring tools that streamline performance data and analyze performance trends in real time can enhance holistic visibility and enable faster issue resolution.
Difficult data analysis
While working in the cloud with dynamic architecture like AWS, it is important to understand the rate at which the demands and services are being scaled. Admins can plan capacity and growth in the cloud infrastructure by estimating on upcoming resource requirements. But with tons of historical data, it almost impossible to analyze performance trends and draw a performance forecast manually for each critical KPI. Without a dedicated monitoring tool that offers predictive analysis, it can be tiring to correlate data from multiple services and arrive at a decision while expanding the AWS infrastructure.
But these challenges cannot stop you from leveraging the full potential of your AWS cloud environment, not when you have a capable AWS monitoring solution to visualize it. ManageEngine Applications Manager is one such performance monitoring solution, helping you access cloud performance data with ease. It can help you unlock all-around visibility into your AWS environment—including all your cloud services like Amazon ECS, Amazon EKS, Amazon SQS, Amazon RDS; databases like DynamoDB, AuroraDB, and many more—and centralizes it into a single console.
How Applications Manager can help
Here is how our application performance monitoring and observability solution can help you delve deep into your AWS architecture and optimize overall cloud performance.
Real-time monitoring
Applications Manager tracks key performance metrics across your AWS services—like disk throughput, memory, response time, and network traffic—in real time. You can monitor service specific KPIs to understand the performance and availability of your cloud services. It allows you to visualize the cloud infrastructure, eliminates blind spots, and makes performance insights easily accessible.
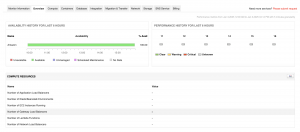
The tool’s ability to comprehend critical dependencies helps you to correlate and understand interdependencies among multiple siloed components and resolve critical conflicts efficiently.
Advanced analytics and code–level insights
Applications Manager provides comprehensive insights about the applications deployed on AWS. Its advanced analytics and byte-code instrumentation open doors to cloud observability. The tool processes large chunks of performance data in real time and utilizes advanced analytics to locate anomalies and identify potential incidents. Applications Manager helps detect erratic queries or functions that might be affecting overall cloud performance with code-level insights, which enables admins to ensure application-level performance remains reliable and stable.
Smart alerting and quick fixes
With the help of Applications Manager’s AI-driven alerting system, you will be able to point out performance anomalies and resolve them before they lead to severe issues. It enables you to set up adaptive threshold profiles for your dynamic components to avoid alert noise.
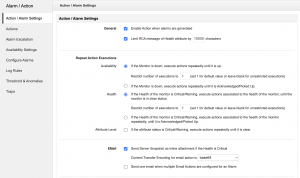
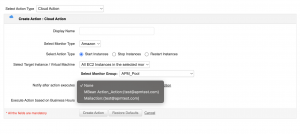
You can automate responsive cloud actions—like starting, stopping, or restarting your EC2 instances—to eliminate manual delay and respond before faulted components cause critical crashes or slow down cloud operations. The predefined severity levels help you prioritize your incidents and automate escalation accordingly, ensuring faster resolution and a seamless end-user experience.
Cost analysis and minimization
You can monitor your AWS billing cycles right from where you track your cloud infrastructure, helping you understand expenditure and taxes with respect to services. For example, you can identify idle EC2 instances and optimize over-provisioned storage volumes in Amazon S3.

This allows cloud spending to stay in line with operational needs. Also, Applications Manager’s predictive analysis offers you a cost forecast based on your cloud expenses that will help you plan around and cut down on unwanted cloud spend.

Unified monitoring console
Applications Manager allows you to monitor over 150 technologies that include cloud applications, databases, containers, ERPs, web servers, on-premises applications, services, and many more. You can also keep an eye on digital experience and measure user satisfaction from the same console.
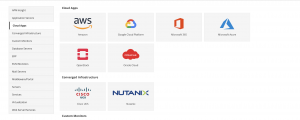
This creates a centralized monitoring interface for all your private, public, hybrid, and multi-cloud environments, eliminating the necessity for multiple monitoring solutions. The customizable dashboards allow you to bring all your critical components to one screen and access them without sifting through multiple tabs.
Integrations with other IT operation management tools
By integrating Applications Manager with IT management tools—like ServiceNow, OpManager, ServiceDesk Plus, Analytics Plus, etc.—you will be able to gain a unified view of your IT operations in real time. This helps you correlate KPI behavior, analyze incidents, and promote faster issue resolution. Applications Manager can also integrate with Slack, making it easy for you to identify and fix performance anomalies by bringing your alerts right to your work channels.
And this is not just it, the tool’s advanced monitoring techniques and vast feature set has made it a favorite for more than 10,000 IT admins worldwide. Download our 30-day, free trial to explore more of the solution.

