Digital experience monitoring (DEM) involves tracking the entire digital user journey of your applications, websites, APIs, and other digital services. It focuses on tracking the performance of your web application from the end user’s perspective, offering in-depth insights on user experience, app performance, and customer satisfaction. This helps IT teams detect, resolve, and prevent possible issues before they affect end users, as well as aids in creating optimization strategies for a smooth and enhanced digital experience.
The need for digital experience monitoring
With the increasing demand for users to perform digital operations seamlessly, such as with e-commerce and online banking, it’s critical to ensure your website or web applications are running without any issues. Any minor performance disruption might affect the day-to-day transactions of your end users, leading to end-user frustration, loss of trust among customers, and a negative impact on your business growth.
Having clear end-to-end visibility on how your web applications are performing and how users are interacting with them in real time can help ensure user loyalty, reduce costs, bolster customer retention, and increase revenue. This is where having a proactive digital experience monitoring strategy comes in.
Challenges in digital experience monitoring
Regardless of how good and robust your digital experience monitoring tool is, there are several challenges that can hinder the digital user experience for your end users.
-
Complexity of digital ecosystems: Today’s digital landscape is a sprawling web of interconnected systems, applications, and platforms. Monitoring how users interact with all of these moving parts can be a challenge, especially if you do not have a clear understanding of how everything fits together.
-
Lack of data accuracy: Large amounts of data collected from various sources in different geographies might lack data accuracy, validity, and reliability due to issues in data collection and processing, making it difficult to analyze and obtain clear insights on application performance.
-
Diverse user conditions: Accessing your application from different regions, browsers, devices, platforms, and network conditions may be susceptible to a diverse number of issues for individual users and can affect the performance and usability of your digital services overall.
-
Network performance impact: Applications that are delivered through various network components, such as servers, routers, and firewalls, can sometimes introduce network latency, traffic congestion, or errors. These can cause unwanted sudden service disruptions for some users.
-
Backend issues: Applications with an interactive and smooth frontend UX can be initiating multiple transactions and method calls in the backend during the use of the application, which can hinder the overall performance for your end users if issues are unattended.
Enhance your digital experience monitoring strategy with Applications Manager
Applications Manager provides a comprehensive digital end user experience monitoring solution with the following capabilities:
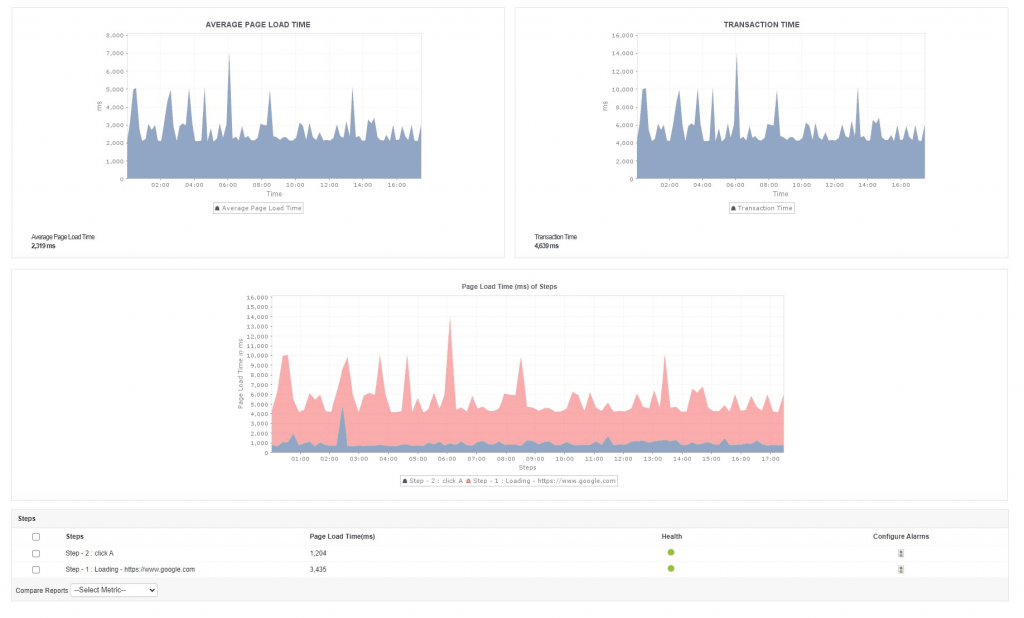
Synthetic transaction monitoring
When an application has completed the development stages and is ready for use, it’s necessary to first perform a thorough check of the application’s functionality to detect issues before going live. You must track the users’ interactions with your application step-by-step by analyzing the performance and detecting potential issues, especially when your application involves critical business operations like online banking, trading, or ecommerce.
Applications Manager’s synthetic transaction monitoring makes it easy for you to monitor the critical user paths of your website or web application and helps you detect any potential issues during the early development stages. You can mimic user actions and gain deep insights into the performance of critical user paths in your application from an end user’s perspective.
The recorder tool enables you to record the most common user interactions, such as button clicks, form submissions, or page scrolls, while navigating through the application. Alternatively, you can use tools like Selenium IDE to record synthetic scripts and then import these scripts into Applications Manager for playback from multiple web browsers, such as Firefox and Chrome.
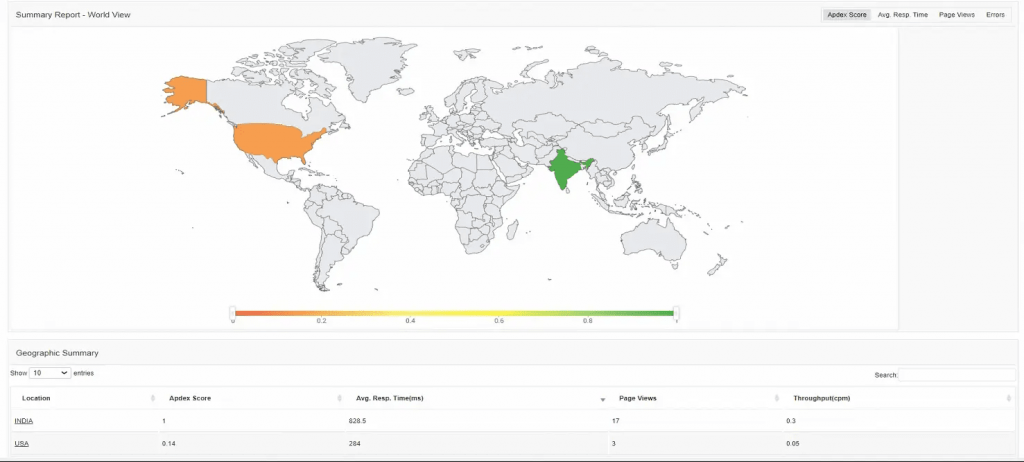
Test playback from various geographical locations, such as enterprise branch offices or actual customer locations ensuring application functionality. Monitoring from multiple geographical locations enables you to identify whether a particular issue is widespread or localized to a specific region, helping you verify if CDNs are functioning correctly and delivering content effectively.
Real user monitoring
Identifying the cause of unexpected performance issues in a real-time deployment is always difficult. In these cases, causes such as server overload, script errors, or external factors like a surge in traffic volume or network issues can be impossible to diagnose quickly.
With Applications Manager’s real user monitoring (RUM), you can enhance the digital user experience of your application by providing admins with complete visibility based on real-time traffic in your application. By understanding how real users experience your application, you can make data-driven decisions to enhance its overall quality and stability.
RUM provides deep, real-time insights into the performance of your web transactions, user sessions, AJAX calls, JavaScript errors, and network response times. It can aid in analyzing how your web application is performing across geographies, browsers, devices, ISPs, and more.
Website monitoring
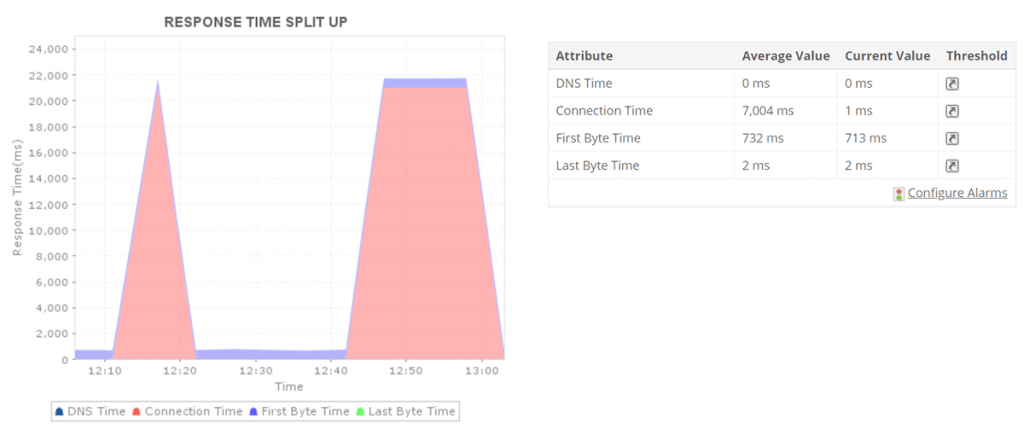
Enhancing the performance of your website is one of the foremost steps to enhancing the digital user experience for your end users. Businesses providing internet banking, online shopping, or trading must facilitate a seamless website experience, enabling users to perform their transactions without any hassles.
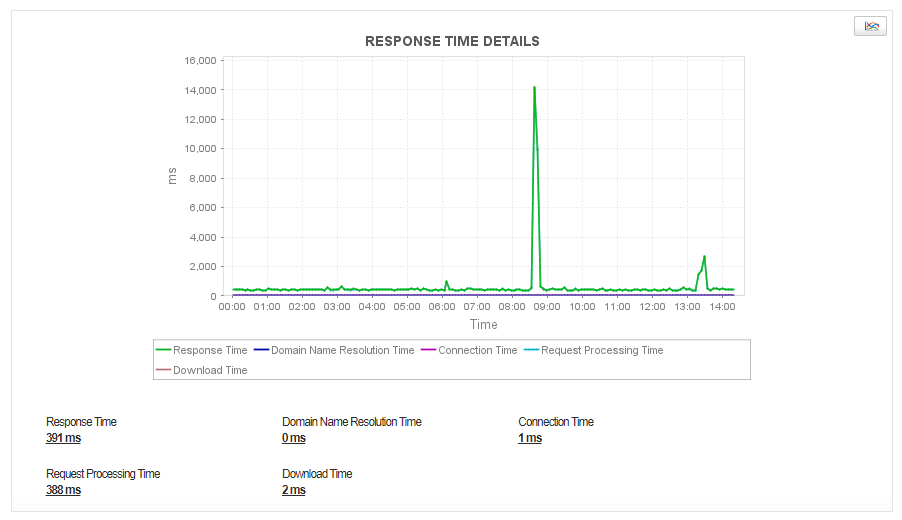
With Applications Manager’s website monitoring, you can keep your website performance on point and ensure a seamless digital experience for your end users. Monitor the performance and availability of your website by tracking individual URLs, which can be helpful in early detection and resolution of potential issues. Verify HTTP requests and monitor the response time of your website with detailed split ups like DNS Time, Connection Time, First Byte Time, and Last Byte Time. You can also simulate the sequence of commonly accessed URLs by online visitors and analyze them to identify and resolve any potential issues.
Application performance monitoring (APM)
Ensuring a good digital end user experience of your applications doesn’t just involve front-end performance monitoring; it requires monitoring backend performance as well. Your backend performance greatly contributes to how your frontend is performing in your application, especially when performing business operations. In case of unexpected backend issues, such as slow SQL queries, delayed loading time, or connectivity issues, it is important to find the exact root cause and resolve it quickly. For this, a good application performance monitoring tool is essential.
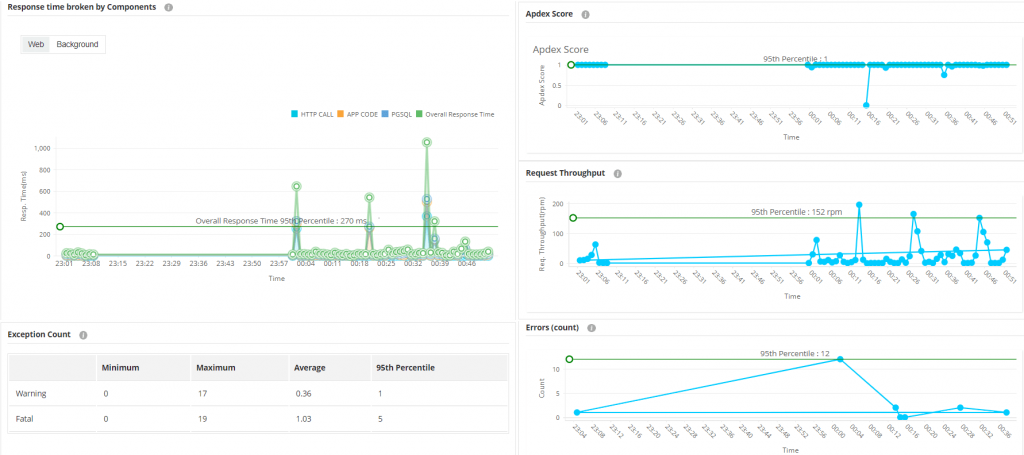
Applications Manager offers deep-APM with byte-code instrumentation, helping DevOps teams gain deep code-level visibility into application performance. It offers a complete overview on your application’s performance by measuring transaction performance, database operations, errors, exceptions, and more. Debug issues quickly in development and production environments with the help of code-level diagnostics, distributed tracing, application service maps, and other capabilities.
By combining APM with DEM, obtain end-to-end visibility into your application performance by monitoring the user satisfaction levels from both frontend and backend perspectives to ensure a seamless digital end user experience.
API monitoring
Modern applications involve a multitude of API calls to various software vendors to request and retrieve data from one another for quick access to information. Although this can enhance your productivity and perform required business operations with minimal time, any unexpected hiccups in the API functionality can affect business performance at a greater scale, which can also negatively impact end-user experience.
With Applications Manager’s API monitoring capabilities, you can easily track the performance of endpoint APIs and triggers instantaneous alerts in case of abnormal functioning or downtime. You can obtain detailed stats on the various response time split ups for your API along with page size and allows you to monitor and configure alerts for custom metrics directly from your API response with ease.
Complement DEM with AI-powered alerting and reporting
With so many diverse sources of monitoring data, you need a powerful artificial intelligence for IT operations (AIOps) system to parse all the data and help you stay on top of critical incidents. Applications Manager’s AI-powered alerting complements its DEM capabilities by collecting data from various sources, analyzing telemetry to provide actionable insights, and enhancing incident detection and response. It filters out irrelevant alerts and reduces event noise, offers predictive analysis based on historical data, and detects anomalies that traditional monitoring systems might miss.
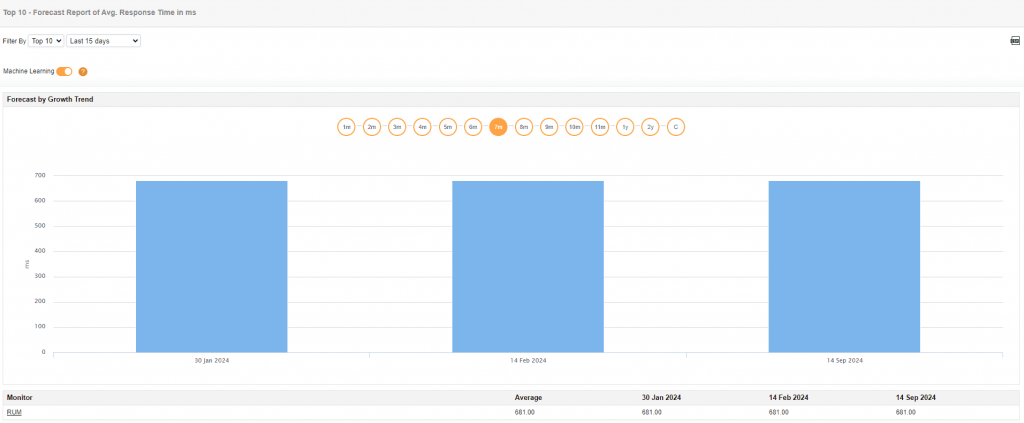
With the help of ML-based forecasting, you can predict the performance of your application from months to years in the future.
Get started with Applications Manager for digital experience monitoring
ManageEngine Applications Manager offers a comprehensive suite of monitoring tools for DEM and beyond. Monitor your application performance, infrastructure, and end-user experience all within a single console. To explore Applications Manager, start a 30-day, free trial or schedule a free, personalized demo with one of our specialists.