Cloud cost management: Anomaly detection
CloudSpend’s Zia framework, powered by AI, is designed to detect any unexpected spikes or irregularities in your cloud expenses. The Zia Anomaly Report aids in optimizing your cloud bills and protecting your cloud infrastructure from unforeseen issues. You have the option to share anomalies with your team through CSV, PDF, or email formats.
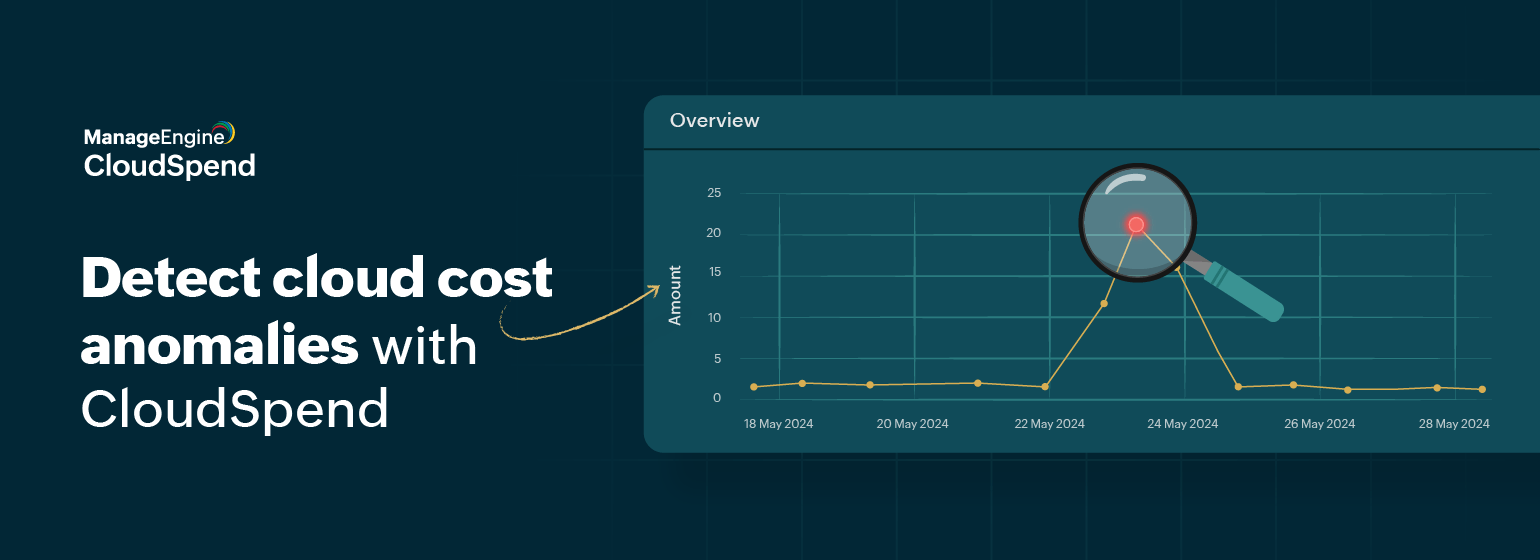
Cloud cost anomalies
The idea behind anomaly detection in cloud expenditures is to pinpoint any abnormal spikes or deviations within a specified time frame. CloudSpend employs AI to swiftly detect anomalies as they occur. By analyzing the cloud costs over the past 180 days, it anticipates any unusual spikes in your cloud expenses.
By utilizing the Zia Anomaly Report, you can:
-
Obtain a comprehensive understanding of the anomalies detected in your cloud account expenses.
-
Detect and resolve abnormal spikes in your cloud expenditures, empowering you to take proactive measures to mitigate cost overruns.
-
Access vital insights regarding cost anomalies through thorough root cause analysis.
The curious case of cost anomalies
Consider Person A, who is exploring new cloud resources such as AWS Elastic Compute Cloud (EC2), or even evaluating existing services. In some instances, they might inadvertently forget to deactivate the resource after analysis or evaluation.
In such a scenario, the cost associated with this particular service might seem insignificant when compared to the total monthly expenditure. However, if the usage remains low but persists over time, it can gradually escalate costs. Moreover, if the cloud resource proves to be expensive, it could significantly inflate overall monthly spending.
By leveraging the Zia Anomaly Report within CloudSpend, users can detect unexpected expenditures at the level of each service or resource, effectively identifying or preventing overspending.
5 ways you can detect cloud cost anomalies in CloudSpend
1. Anomaly Summary dashboard
This dashboard displays category-based anomalies by factors such as region, service, Kubernetes tags, and linked accounts, aligning with the categories mentioned under CloudSpend Reports. The calendar function enables users to filter anomalies occurring within a specific time frame.
Users can filter anomalies based on their status, which aids in organizing detected anomalies. The supported statuses include:
- Open: This default status displays all detected anomalies.
- False Positive: This status indicates anomalies that are incorrectly identified. Users can mark anomalies as false positives if they determine they’re not genuine.
- Acknowledged: Anomalies in this state are confirmed as true detections.
2. Anomaly category
The anomaly category exhibits a compilation of report category entities that have encountered an anomaly. Users can select the relevant entity to access crucial insights and scrutinize the detected anomalies.
Users have the option to establish a custom date range, which enables them to observe anomalies that transpired within it. Furthermore, users can filter and examine the roster of Open, False Positive, and Acknowledged anomalies.
3. Anomaly report
As discussed above, where the user detected an anomaly in AWS EC2, the Anomaly report lets them take actions on the detected anomalies through detailed insights.
The Similar Anomalies widget aids in recognizing anomalies that coincide with the time frame of the EC2 anomaly. Additionally, a graphical representation of all Open, False Positive, and Acknowledged anomalies is presented. From the Anomaly page, users can access details such as Last Incident Time, Severity, Deviation, and Expected values. The History feature offers insights into similar incidents associated with the EC2 anomaly.
4. Root cause analysis
The Root Cause Analysis view furnishes details regarding the timing of the anomaly incident, the corresponding expenditure, and forecasts of data. Gain insights into the detected anomaly for the entity, including details such as Status, Incident Time, Deviation, Level, and Cloud type.
5. Forecasting
Users can view a color-coded forecasting section on the Root Cause Analysis page. The blue line denotes the actual cost incurred, the peach line signifies a high forecasted value, and the green line represents a low forecasted value. The Cost section showcases the cloud expenditure accrued during the period the anomaly was detected, with projections based on the spending pattern during that time frame.
CloudSpend’s Zia framework feature is just one part of being a holistic cloud cost management tool that helps enterprises manage cloud expenses and cut OpEx across multi-cloud environments, such as AWS, Azure, and GCP. To learn more about CloudSpend’s Zia framework, please refer to the documentation.
