
Apache, the world’s most popular web server software, powers an estimated 30.2% of all active websites. Known for its reliability, flexibility, and robust features, Apache has been the backbone of the internet for decades. From small personal blogs to large-scale e-commerce platforms, Apache’s versatility allows it to handle a wide range of web applications with ease.
In this blog, we will take a look at the inner workings of the Apache web server, explore essential metrics for Apache monitoring, and discover optimization strategies to ensure your web server operates at its peak efficiency.
How does Apache’s web server work?
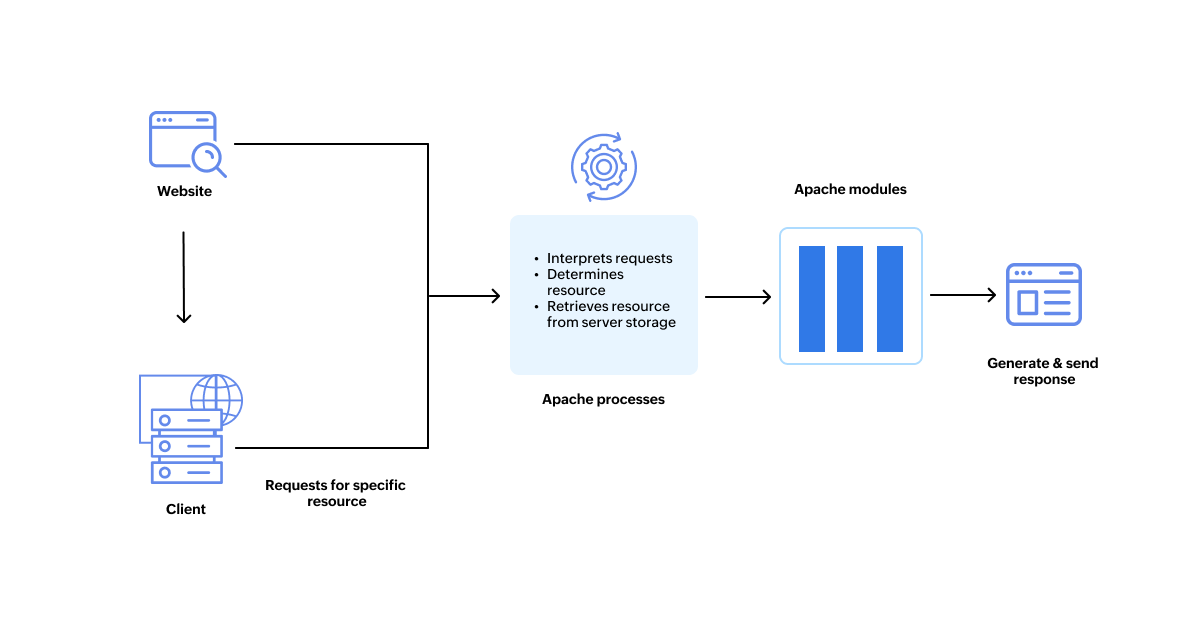
Although web servers involve intricate processes, their fundamental function remains consistent: accepting incoming requests and delivering the corresponding webpage components in response. Apache stands out in this aspect by enabling secure client-server communication through HTTP/HTTPS. Apache’s configuration is managed via its configuration files, where modules play a pivotal role in controlling its behavior. These versatile modules can be tailored for tasks like caching, encryption, URL rewriting, and more.
Here is where Apache truly shines: it listens for incoming requests using the Listen directive. This directive specifies the port on which Apache should wait for incoming connections. By default, Apache uses port 80 with the Listen directive, but it can be configured to listen on different ports for individual domains, allowing for hosting multiple websites on a single server. When the message reaches its destination successfully, the underlying TCP/IP protocol acknowledges successful data transfer.
Essential Apache metrics: What to monitor and why
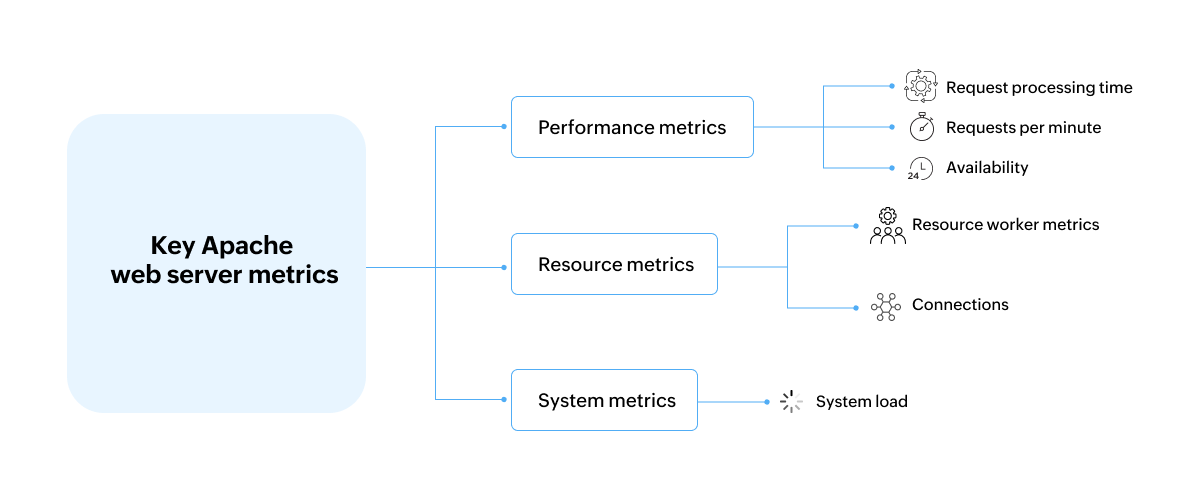
Performance metrics
- Request processing time: Slow processing times can indicate bottlenecks within your web application stack. Sometimes, Apache might not be the culprit itself. It could be sluggish database queries, slow PHP code execution, or resource limitations on the server. By monitoring request processing time, you can isolate issues and identify the specific component causing delays.
Actions you can take based on processing time
High processing time
- Investigate other components: Analyze database queries, PHP code execution, and overall server resource usage to pinpoint the exact source of the slowdown.
- Review KeepAliveTimeout: A high KeepAliveTimeout can keep worker threads occupied for extended periods, even when clients aren’t actively using the connection. Reducing it cautiously can free up worker threads and improve responsiveness, but be mindful of potential drawbacks like more frequent connection re-establishment.
Low processing time
- Look out for false positives: Extremely low processing times might not always be ideal. This could indicate that your pages might lack dynamic content or basic functionalities. Analyze if the content being served meets the requirements of your website. Understand if your static pages are supposed to be simple, or if they should have more dynamic elements.
- Review optimization practices: Very low processing times after optimizations suggest potential over-optimization. It is imperative to evaluate if unnecessary optimizations can be scaled back, thus achieving a balance between performance and efficient resource utilization.
2. Requests per minute: The number of requests per minute (RPM) that can be handled by Apache depends on various factors like server hardware, configuration, and the nature of requests. While Apache can theoretically handle hundreds or even thousands of RPM, the actual number depends on your setup and workload. Factors like request size, server-side code complexity, and available system resources contribute to determining its real capacity.
Monitoring Apache server RPM can help identify situations that require your immediate attention. By tracking RPM, you can gain valuable insights into your server’s health. Consistent increase in RPM might indicate that your server is nearing its capacity and could benefit from additional resources (CPU, memory) to maintain optimal performance. Conversely, a sudden drop in RPM can be a red flag for server-side issues like excessive disk swapping or database crashes. By monitoring RPM and understanding its implications, you can identify potential problems early on and take steps to address them before they impact your users.
3. Availability: It’s historically proven that outages tend to have an extreme effect on end users, which is why monitoring Apache availability is paramount. Several measures can be taken to achieve high availability for your Apache Web Server:a) Load balancing: Distribute incoming traffic across multiple Apache servers, preventing overload on a single server. This ensures continued service even if one server experiences issues.

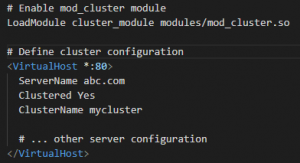
b) Clustering: Configure multiple Apache servers to work together as a cluster. In case of server failure, another server can seamlessly take over to minimize downtime.
c) Regular maintenance and updates: Schedule regular maintenance tasks like software updates and security patching. Perform these tasks during off-peak hours to minimize disruption.
Additionally, implementing an optimal Apache server monitoring tool can help you gain visibility into the overall availability and health of your web server periodically, ensuring its optimal performance.
Resource metrics
- Worker resource metrics: Worker resource metrics are essential aspects of Apache server monitoring, representing the processes or threads responsible for handling incoming requests. Monitoring worker resource metrics, such as busy and idle workers, will help you understand whether your resources are being over or underutilized. Some strategies that will help optimize worker usage include analyzing resource consumption, optimizing code, and considering server scaling.
Impact of idle and busy workers
- Idle workers: A small number of idle workers is usually acceptable as they indicate some spare capacity for handling sudden traffic spikes. However, an excessive number of idle workers can consume memory and CPU resources without contributing to resource handling. For example, if the MaxRequestWorkers directive is set too high, Apache may create more worker processes than necessary, leading to wasted resources. To optimize, you can adjust the MaxRequestWorkers directive to an appropriate value based on server resources and expected traffic.
- Busy workers: When all workers are busy handling requests, incoming requests may be queued, resulting in longer response times for users. This can lead to a degraded user experience and potential timeouts. Optimizing the MaxRequestWorkers will help ensure that the server can handle the expected workload without queuing too many requests.
- Connections: Monitoring connections in your Apache web server is vital for maintaining performance, identifying potential issues, and ensuring overall web server health. Here is how tracking different connection types provides valuable insights:
- Understand server load: Tracking total and asynchronous connections will help you gain a general idea of server load and identify if asynchronous operations are consuming excessive resources, respectively.
- Optimize resource usage: Writing connections are used for sending data back to clients. Tracking their volume helps assess bandwidth usage and identify potential bottlenecks. For example, if writing connections consistently reach their peak, it might suggest insufficient bandwidth or server-side code inefficiencies causing slow data transfer.
- Improve user experience: Keep-alive connections allow multiple requests to be sent over a single connection, reducing handshake overhead and improving performance. Tracking this helps ensure connections are functioning properly and contributing to faster response times.
- Debug and troubleshoot: Monitoring connection closure rates helps identify potential issues like abrupt client disconnects or server-side errors that might prematurely terminate connections. A high rate of closing connections without proper termination could signify application bugs or network connectivity problems.
System metrics
- System load: Monitoring system load in the Apache web server is crucial for optimal performance and efficient request handling. System load indicates the workload on the server’s CPU, representing the average number of processes in a runnable or uninterruptible state. Load averages are calculated over different time intervals (one, five, and 15 minutes) to understand system behavior accurately.
Apache web server monitoring helps identify high system load, which often suggests heavy demand, potentially leading to slower response times. This metric is often used to identify bottlenecks, plan upgrades or scaling, and ensure the server operates within capacity.
Comparing the most popular web servers: Apache vs. Nginx vs. IIS
Apache is often compared to other popular web servers like IIS, Nginx, and IIS, each of which have their unique advantages. Choosing a web server, Apache, Nginx, or IIS, typically depends on your specific needs and priorities. However, you need to consider some of the factors before making your choice: basic architecture, performance, configuration, security, and more. Here is a breakdown that will help you decide:
Feature |
Apache |
Nginx |
IIS |
|
Overview |
Apache is open-source software that handles client requests and serves web content via HTTP/HTTPS. It is a component of the LAMP stack, ensuring compatibility with a wide range of programming languages, content management systems, and web frameworks. |
Nginx is a popular web server that doubles as a reverse proxy server, load balancer, and HTTP/HTTPS cache. Initially designed to solve the C10K problem, this web server is well-known for its capacity to manage high volumes of traffic and scale effectively with minimal hardware. It’s a key component of the LEMP web stack, which is an alternative to the LAMP setup. |
Created by Microsoft to be used on Windows servers, IIS supports various protocols including HTTP, HTTPS, FTP, SMTP, and more, making it versatile for different web services. It also offers features like built-in security measures, request filtering, application pools for managing web applications, and more. |
|
Handling connections |
Apache creates a single thread and multiple processes to handle each connection request. However, this leads to heavy resource consumption, impacting speed. To avoid this from occurring, Apache provides various multi-processing modules (MPMs) like mpm_prefork, mpm_worker, and mpm_event that determine how HTTP requests can be accepted and handled. |
Nginx uses a master-worker architecture for handling connections. This event-driven model leverages the event loop to handle connections without creating new threads for each one. This helps Nginx process multiple requests simultaneously, making it ideal for high-traffic websites and popular content delivery networks such as MaxCDN, Cloudflare, etc. |
IIS follows a flexible worker process model where you can configure the number of worker processes to optimize resource usage and performance. |
|
Configuration and security |
Apache web servers utilize .htaccess files for per-directory configuration, granting non-privileged users control over specific website settings without direct access to main configuration files. Apache also ensures web server security by implementing configuration settings to prevent DoS attacks. |
Directory-level configurations aren’t supported by Nginx. While Nginx provides default security features, its premium version, Nginx Plus, enhances security with the ability to manage multiple websites and applications using a single set of credentials. |
IIS relies on a central administration tool for configuration, offering more granular control but requiring administrative privileges. In addition to DoS prevention, IIS also supports features like request filtering and user authentication for enhanced security. |
|
Advantages and disadvantages |
Apache offers strong community support, enhanced security, and module flexibility. However, drawbacks include being resource-intensive and having complex configuration requirements. |
Nginx is popular for its speed and for being an efficient reverse proxy server. Being an event-based server, it enables high performance and scaling. Limited platform and community support is a drawback. |
IIS easily integrates with Microsoft services like Active Directory, Microsoft SQL, and more. However, it’s not as customizable as open-source web servers. |
|
Cost |
Apache is a free, open-source web server that requires no licensing fee. |
Nginx is a free, open-source web server. |
IIS comes bundled with a Windows Server license. |
Irrespective of the web server you choose, Applications Manager provides a comprehensive solution for monitoring and managing your web infrastructure. With support for Apache, Nginx, IIS, and other popular web servers, Applications Manager offers real-time insights into key performance metrics, resource utilization, availability, and more. To learn how our product can help you, download a free, 30-day trial or schedule a personalized demo with one of our experts today!