Author: KK
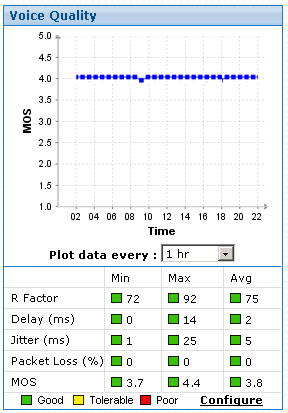
VQManager depicts QoS values of all the calls using E-model. The various QoS details displayed by VQManager are R Factor, Jitter, Delay, Packet Loss and MOS value. The maximum, minimum and average of all the above parameter are mentioned in a tabular fashion. Adjacent to each statistical value are small color-coded box which signifies whether the values are within the tolerable range or below / above it.

Most of you must be wondering what?s new in this? It was already there in VQManager 5.0.
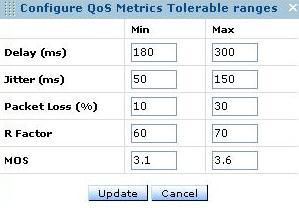
The answer is simple?At VQManager we realized although the QoS value has some standardization each network is individually different. The tolerable range in each network can be different depending on the network, its usage and other factors. When such is the case, how can we have same tolerable limit across various networks?
That?s exactly what VQManager 5.1 address?it gives you flexibility of defining your own QoS value ranges. It gives you freedom to tune the VQManager according to the tolerable range of your network. When the QoS metric values are less than the tolerable range specified by you it is classified as Poor quality whereas when it exceeds the tolerable range it is classified as Good quality.

Well if you thought it was only Themes which was customisable..You know you were wrong!!