The task of monitoring and managing an entire network, including all the servers and applications that run on it, is by no means easy. With so many components of varying complexity, the volume of performance data coming at you can be overwhelming. This information overload increases the chances of missing data that could help discover performance inefficiencies.
Another aspect that’s often overlooked is the return on investment (ROI) for the IT infrastructure. Since IT teams are accustomed to the firefighting model, they might not be actively looking at how effectively their infrastructure is being used and if they’re getting the most for their money. So, how do you isolate what matters the most and ensure you’re not overspending on your infrastructure?
Infrastructure dashboards are an ideal way to pick specific business-critical aspects of your network, server, or application infrastructure, and organize them in a single place.
Infrastructures can be deployed on-premises or on private or public clouds. Hybrid deployments, which involve a combination of these deployment modes, are pretty common. Designing the dashboards for each of these deployment types, however, should be approached differently.
For example, in the case of a public cloud deployment, you may not have to worry too much about availability, because public cloud vendors own the responsibility of ensuring uptime. On the other hand, the responsibility of ensuring availability in an on-premises or private cloud deployment falls on that organization’s IT team.
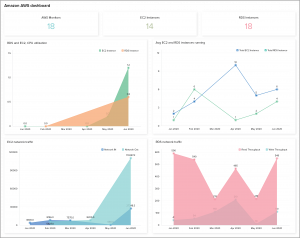
AWS dashboard
For an organization that relies on an AWS infrastructure, the two primary metrics that are important to monitor is infrastructure usage and the performance of their applications. This is because public cloud vendors such as Amazon, Microsoft Azure, and Google charge for their services depending on server configuration and the duration of usage. Organizations should ensure they get optimal performance from their servers and ensure they are not paying for servers that are idle.

Metrics such as the number of AWS, EC2, and RDS instances in use along with a trend of historical usage let organizations closely track the scale of deployment, and determine if it’s in line with business needs. Metrics such as RDS and EC2 CPU utilization, RDS and EC2 network traffic, and disk I/O indicate whether the server configuration matches their performance needs.
Organizations with a hybrid deployment, i.e, a combination of apps running on-premises and on public cloud, should use a section of this dashboard to display alarms raised from the AWS infrastructure to make it easy to isolate issues faster. Faster resolution leads to less downtime and happier customers.
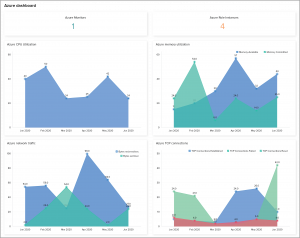
Microsoft Azure dashboard
The approach to building an Azure dashboard is similar to that of an AWS dashboard due to close similarities in the deployment model. A good balance of usage and performance metrics is ideal for IT teams to stay on top of their Azure infrastructure.

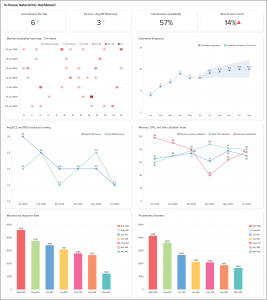
On-premises or private cloud infrastructure dashboard
The key aspect to consider in building a dashboard for on-premises or private cloud infrastructure deployments is that the IT team is responsible for managing both the infrastructure uptime as well as the performance of the apps that run on them. This means the dashboard should include uptime metrics, processes, and services that run in servers; network bandwidth; and application performance.

Building these dashboards from scratch can be a daunting and time-consuming task. When integrated with ManageEngine Applications Manager, Analytics Plus offers these prebuilt infrastructure dashboards.
The integrated combination of Analytics Plus and Applications Manager also auto-generates over 100 reports and dashboards highlighting various areas of your IT infrastructure. With a self-service first approach, anyone in the organization can build their own dashboards using a drag-n-drop report builder, or get insight on-demand using Zia, our voice-activated intelligent analytics assistant.

