
NoSQL databases have always been regarded as a notch above SQL databases. The primary reason for the soaring popularity of NoSQL databases is their dynamic and cloud-friendly approach to seamlessly processing data across a large amount of commodity servers. With high scalability, availability, and reliability, AWS’s DynamoDB is a great example of a fully-managed NoSQL database.
If your organization is using DynamoDB, there are a few key metrics you need to track to ensure your applications run smoothly. Overlook these key numbers and you risk missing the mark of optimal application performance. Let’s take a closer look at the DynamoDB monitoring metrics you need to keep track of:
1. Throttled requests and throughput capacity
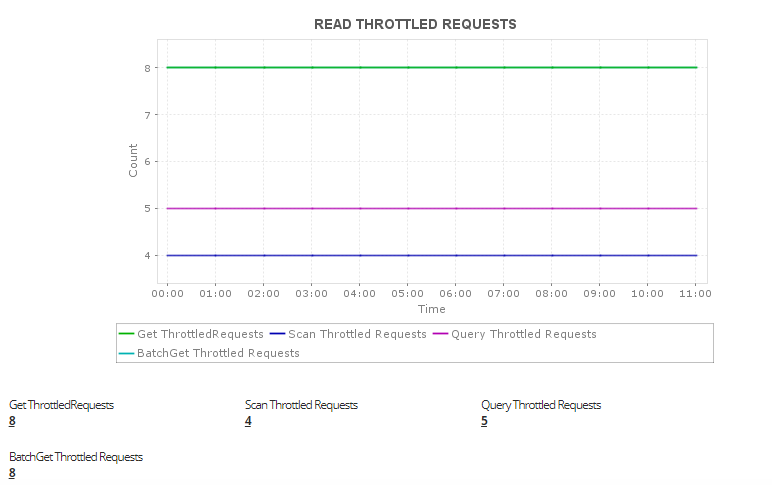
To ensure consistent and low-latency performance of your applications, it’s essential to define throughput capacity for R/W activities in advance and make sure they’re sufficient for your application’s needs. If your read or write requests exceed the limit you set—meaning consumed throughout is greater than provisioned throughput— DynamoDB will throttle the request; in other words, it will limit the number of requests that can be submitted to an operation in a given amount of time. This process is based on a concept called the “leaky bucket algorithm,” which protects the application from being overwhelmed with requests. When a request gets throttled, the DynamoDB API client can automatically retry it.
Metrics to watch for:
- Consumed and provisioned R/W capacity units: One read capacity unit represents one read per second for an item up to 4KB in size. Reading an item larger than 4KB consumes more read capacity units. One write capacity unit represents one write per second for an item up to 1KB in size. Tracking R/W capacity units will help you spot abnormal peaks and drops in R/W activities.
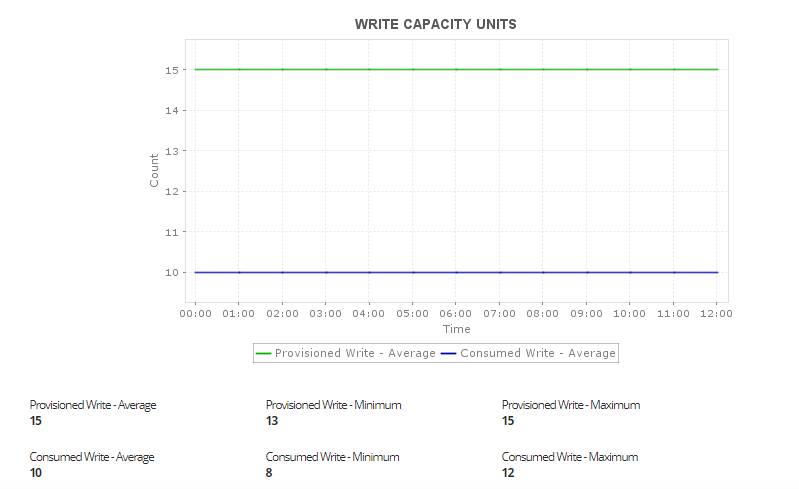
- Burst capacity: When a table’s throughput is not completely utilized, DynamoDB saves a portion of this unused capacity for future “bursts” of R/W throughput. DynamoDB can actually use this burst capacity to avoid throttled requests; if burst capacity is available, R/W requests that exceed your throughput limit may succeed. However, burst capacity can change over time and may not always be available, so an evenly distributed workload is critical for optimizing application performance.
2. Latency
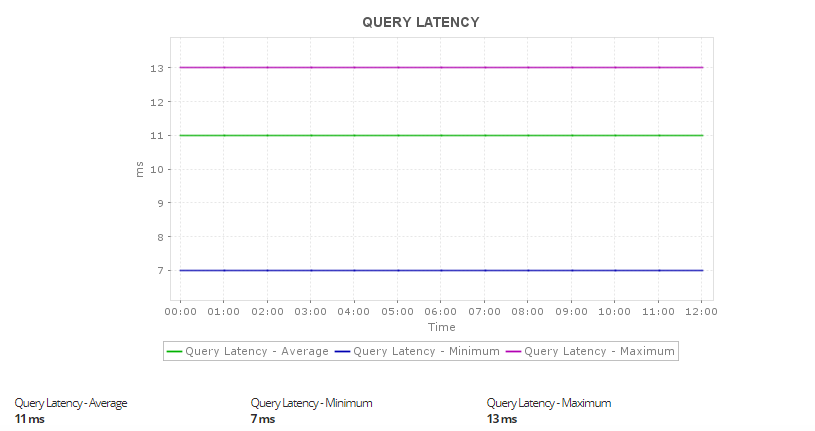
From an end user’s point of view, latency is one metric that determines how efficient your application is. For a smooth end-user experience, DynamoDB provides latency in single digit milliseconds to applications running on any scale. This means even when your application grows and starts to store a huge amount of data, DynamoDB will go on to provide fast and consistent performance. Latency is usually the best when you’re using the instance located in the same region.
3. Errors
If a request is unsuccessful, DynamoDB returns an error that contains three components:
-
HTTP status code
-
Error message
-
Exception name
Metrics to watch for:
-
System errors: This represents the number of requests that resulted in a 500 (server error) error code. It’s usually equal to zero.
-
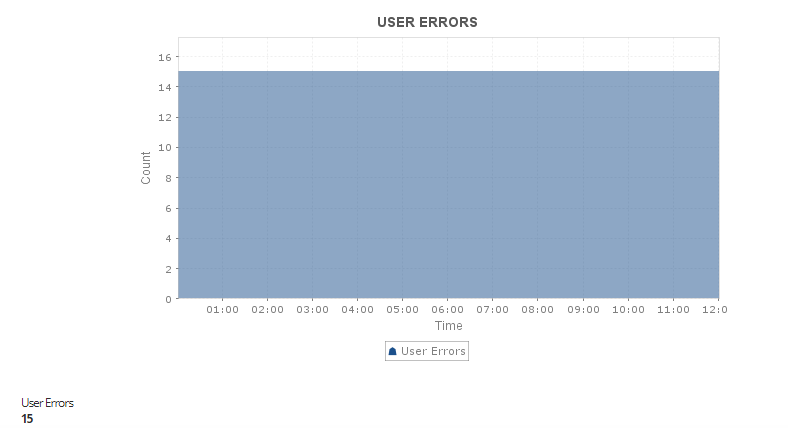
User error: This represents the number of requests that resulted in a 400 (bad request) error code. If the client is interacting correctly with DynamoDB, then this metric should be equal to zero.
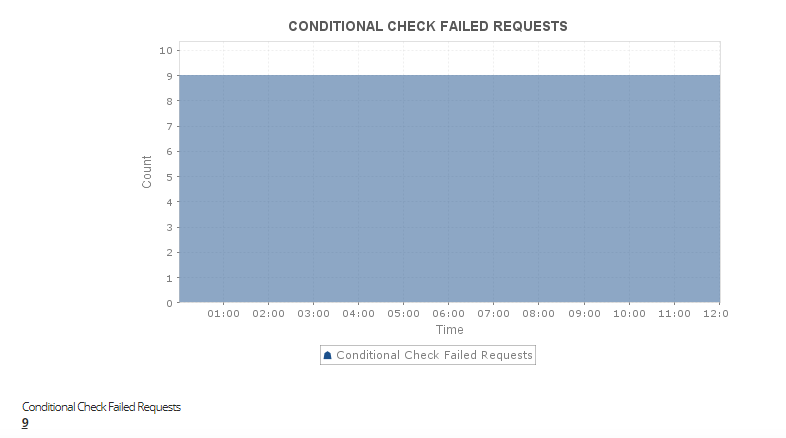
- Conditional check failed requests: This refers to the logical condition for a write request that tells you whether an item can be modified or not. This error is considered separate from a user error even though a 400 (bad request) error code is returned.
4. Global secondary index
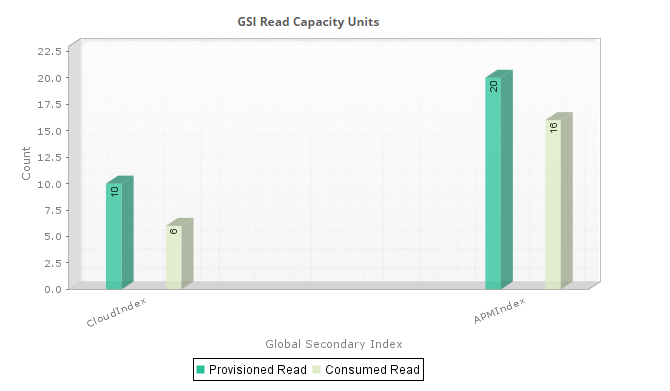
Although DynamoDB provides quick access to items in a table by specifying key primary values, applications may benefit from having one or more secondary keys for efficient access. To illustrate, consider the table below named “Shopping cart” that keeps track of top-selling books. Each item in the cart is identified by a partition key (ID) and a sort key (book title). While performing an action, an application might struggle to retrieve data from “Popular books” based on book title only because ID is the partition key; it’s much easier to display the top two books based on ID and book title.
Popular books
|
User ID |
Book title |
No. of purchases |
|
101 |
The Kite Runner |
1,990 |
|
102 |
1984 |
1,790 |
|
103 |
Norwegian Wood |
1,700 |
This is where a global secondary index (GSI) can help. A GSI contains a selection of attributes from the base table but is organized by a primary key different from the table. This increases the performance of queries on non-key attributes. Storage considerations should be kept in mind as allocating resources for the new index might take longer for larger tables.
Metrics to watch for:
-
R/W capacity units
-
GSI throughput and throttled requests
-
Online index throttled events
-
Online index consumed write capacity
If you’re new to DynamoDB, the above metrics will give you deep insight into your application performance and help you optimize your end-user experience. To make it easier for you, Applications Manager’s Amazon DynamoDB monitoring offers in-depth insights on problematic nodes and root cause analysis of performance issues. Try a free, 30-day trial of Applications Manager to evaluate your monitoring requirements now!
