Ensuring your application is up and running is never enough. It’s essential to ensure that your application is fast and also error-free to deliver a buttery smooth digital experience for your users. An application performance monitoring (APM) tool will help you track the performance of your application with metrics, reports, and automated alerts, but it doesn’t always capture how real users experience your application.
Here’s where real user monitoring (RUM) steps in, adding a layer of real-time, user-centric insights to the mix. This way, you can get a complete picture of your application performance metrics to ensure back-end stability and a positive real-world user experience. Combining these monitoring tools together is great for your business’s bottom line. So, let’s explore more about how RUM helps augment APM with real user telemetry data.
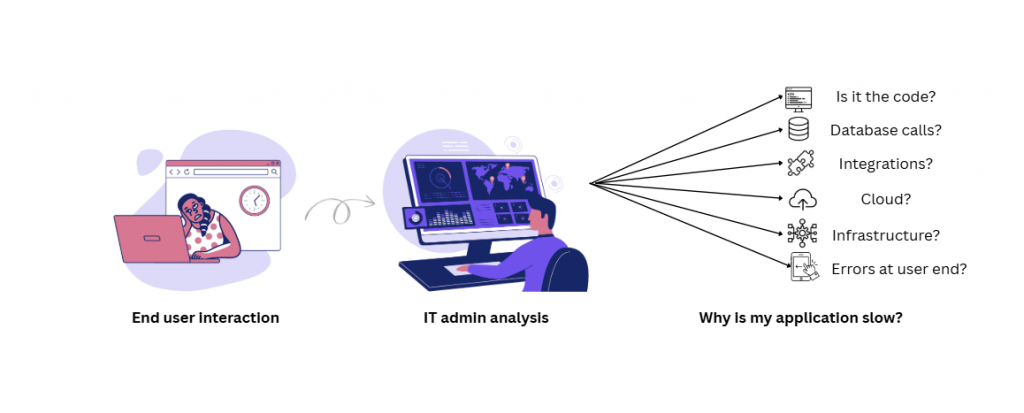
End-to-end visibility with APM—or are you missing something?
APM provides you with tools to track your applications’ health, including application code efficiency, database performance, server side metrics, and everything else that an application is connected to. APM quantifies your applications’ health with metrics to identify bottlenecks by providing insights into back-end operations. While APM provides visibility into the application back end, it does not provide any data on the real user experience.
APM primarily focuses on:
Back-end infrastructure monitoring: Ensuring servers, databases, and APIs perform optimally.
Application code efficiency: Tracking thread activity, memory utilization, and resource utilization.
Transaction and dependency analysis: Understanding how different components of your application interact.
Trace analysis: Examining the full path of a request through the application, from the front end to the back end, to identify the location of the bottleneck.
But while APM gives you great back-end visibility, it doesn’t always tell the full story. A user in Japan may experience page load delay, while a user in India has the optimal experience. Response time can be affected due to users’ OS constraints or due to webpage resources. A script error may cause a user session to break. These are the gaps RUM fills in.
How RUM complements APM to provide a well-rounded monitoring solution
Many APM key performance indicators become even more insightful when combined with RUM data. Here are some examples:
- High server response time + slow page load time: APM detects slow back-end responses by analyzing server performance and database query execution. RUM augments this by capturing front-end load times, user interactions, and rendering delays, giving a full picture of how users are impacted.
- Low error rate + high user complaints: APM captures back-end errors but may not detect UI-related issues. RUM tracks JavaScript errors, broken UI elements, and user frustration signals through session replays and JavaScript error monitoring.
- Optimized database queries + high bounce rates: Even if queries are optimized, users may abandon a page due to poor webpage rendering, excessive third-party scripts, or large resource loads. RUM identifies these issues through page load analysis and session tracking.
- Server health + geographic performance variations: APM ensures back-end stability by monitoring server and database performance. RUM detects latency variations across geographies by analyzing real user request times, CDN efficiency, and network delays for localized performance insights.
- High CPU or memory utilization + sluggish UI: APM identifies resource bottlenecks by analyzing CPU, memory, and thread utilization. RUM correlates this data with front-end responsiveness, slow rendering of page elements, unoptimized assets, and heavy scripts impacting real user interactions.
- Low API latency + long user wait times: Fast API responses indicate back-end efficiency but don’t guarantee smooth user interactions. RUM tracks the core web vitals, like front end processing times, poorly rendered resources, and script execution delays, to pinpoint bottlenecks affecting the real user experience.
- Frequent back-end errors + user frustration signals: APM logs back end errors by tracking exception rates and failure points. RUM captures user behavior, such as rage clicks, session abandonment, and high exit rates, highlighting user frustration caused by front-end issues or a poor experience.
Unifying APM and RUM for comprehensive monitoring
Want to bridge the performance gap in your applications? Explore how Site24x7’s APM and RUM features can help you monitor and optimize the entire user journey!
Using APM alone is like checking an engine’s health without ever taking the car for a test drive. It gives you great insights into what’s happening under the hood but doesn’t tell you how it feels to drive. Pairing APM with RUM provides end-to-end visibility, ensuring both back-end stability and an optimal user experience.
Together, APM and RUM:
- Deliver full-stack visibility, from server performance to real user interactions.
- Enable faster troubleshooting with insights into both back-end and front-end issues.
- Ensure a seamless digital experience, helping reduce churn and boost customer satisfaction.
If you’re serious about delivering top-notch performance, combining APM and RUM is the way to go—don’t let blind spots impact your user experience.