Microsoft SQL Server is a critical database component of many business applications, ensuring data integrity, fast query performance, and seamless transactions. However, maintaining peak performance requires proactive monitoring of essential metrics. In this blog, we’ll explore the key SQL Server performance metrics you should track and how they help prevent performance issues, optimize resource usage, and enhance database efficiency.
1. CPU utilization
Monitoring CPU usage helps identify performance bottlenecks caused by inefficient queries or high workload demand. If CPU utilization is consistently high, it may indicate the need for:
-
Query optimization to reduce computation-heavy operations.
-
Indexing to minimize unnecessary scans.
-
Additional resources or workload redistribution.
-
Identification of resource-intensive processes consuming CPU cycles.
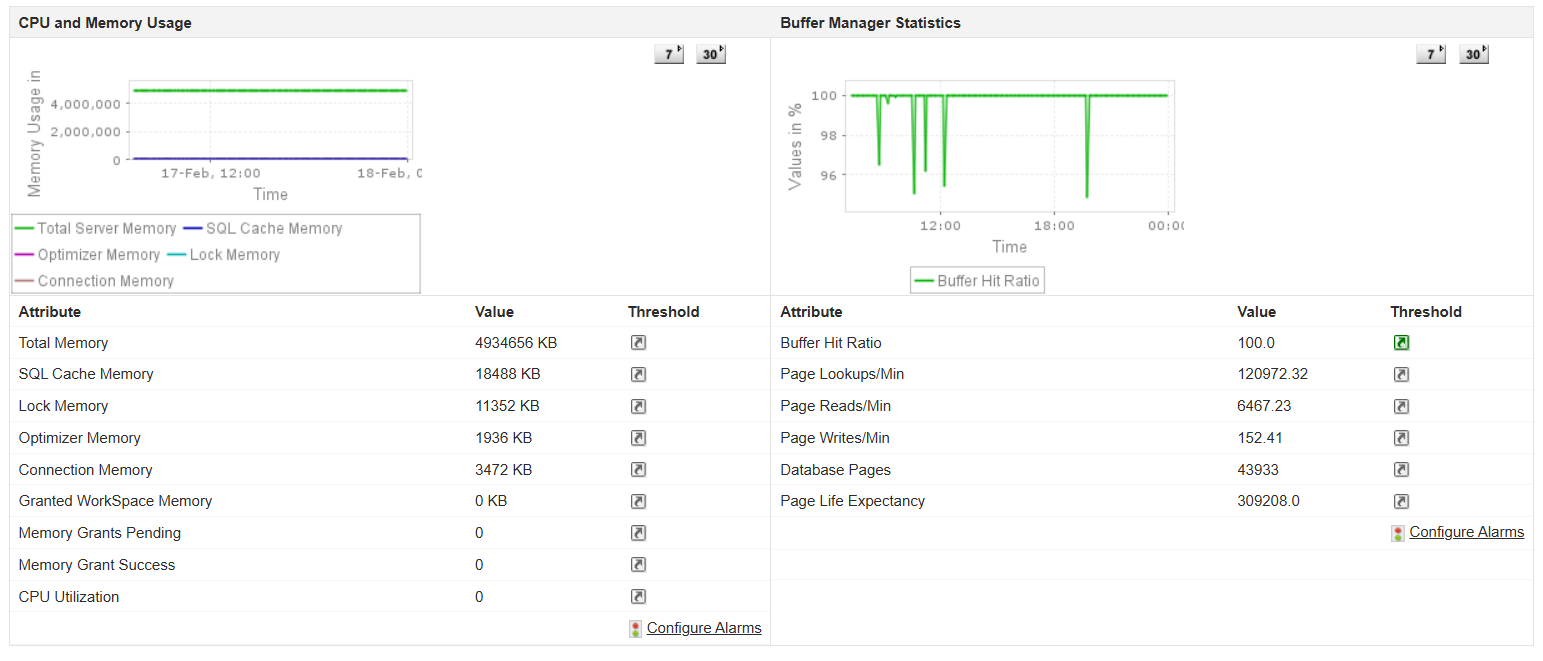
2. Memory usage
SQL Server databases rely heavily on memory for caching data and query executions. Monitoring memory usage—including buffer cache hit ratio (BCHR) and page life expectancy (PLE)—ensures efficient memory allocation. A low BCHR (below 90%) signals that queries rely too much on disk storage, causing latency issues. Additionally, tracking pending memory grants and memory grant success rates helps identify query delays caused by insufficient memory allocation.
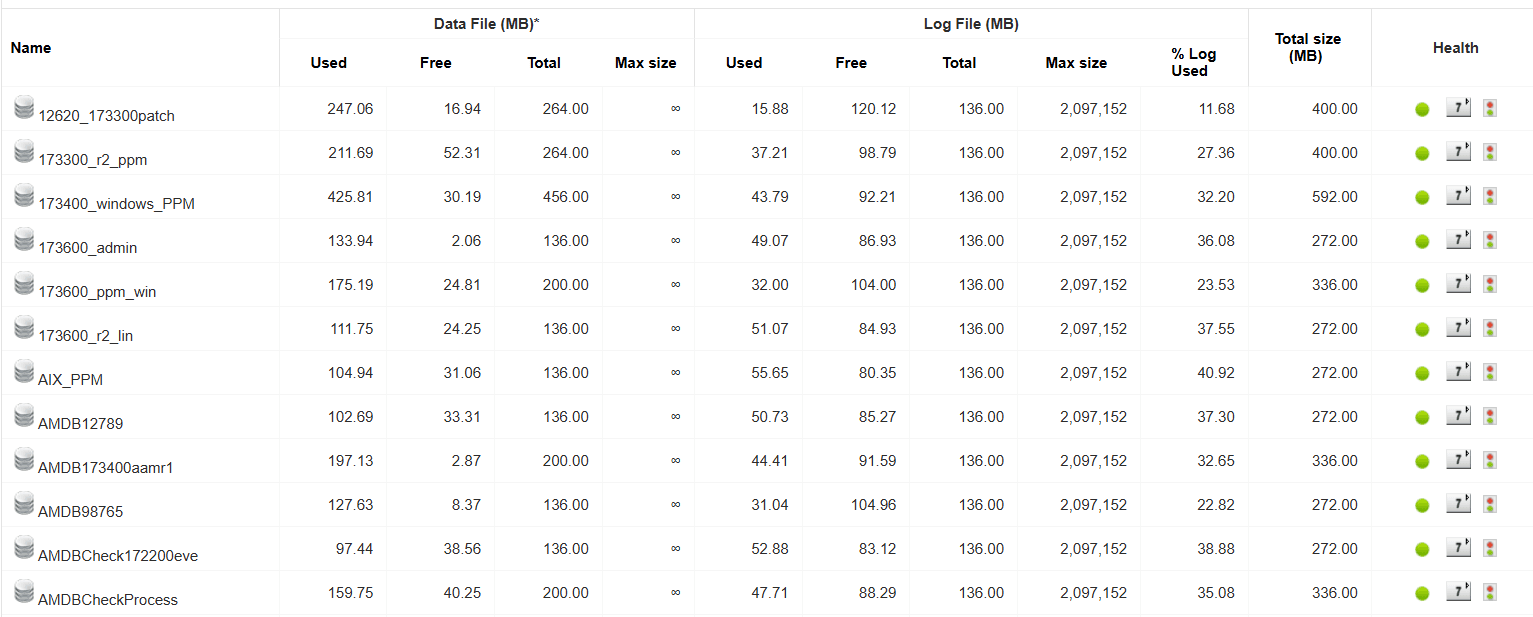
3. Disk utilization
Tracking disk activity helps detect high I/O operations that may degrade performance. Monitor read/write latency and disk queue length to identify disk bottlenecks. Additionally, keep an eye on data file and log file utilization to ensure adequate storage and prevent performance slowdowns. High occurrences of full scans might indicate missing indexes or poorly optimized queries.
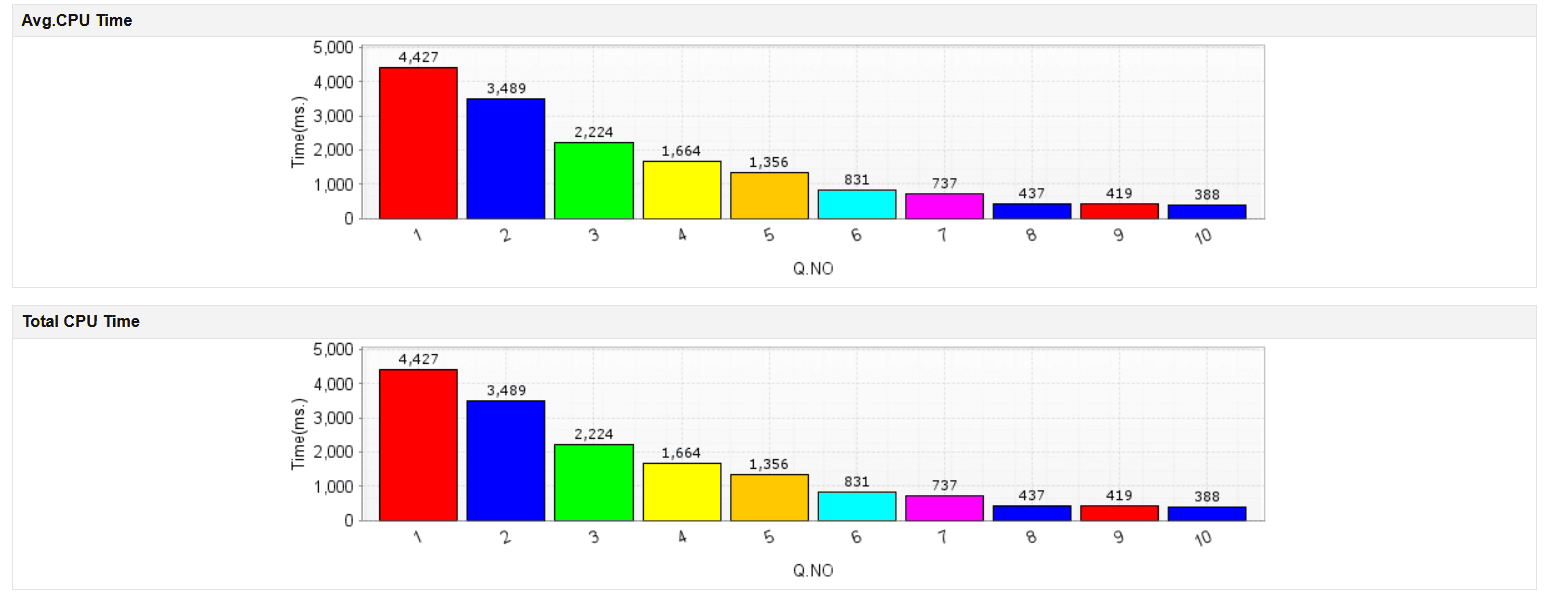
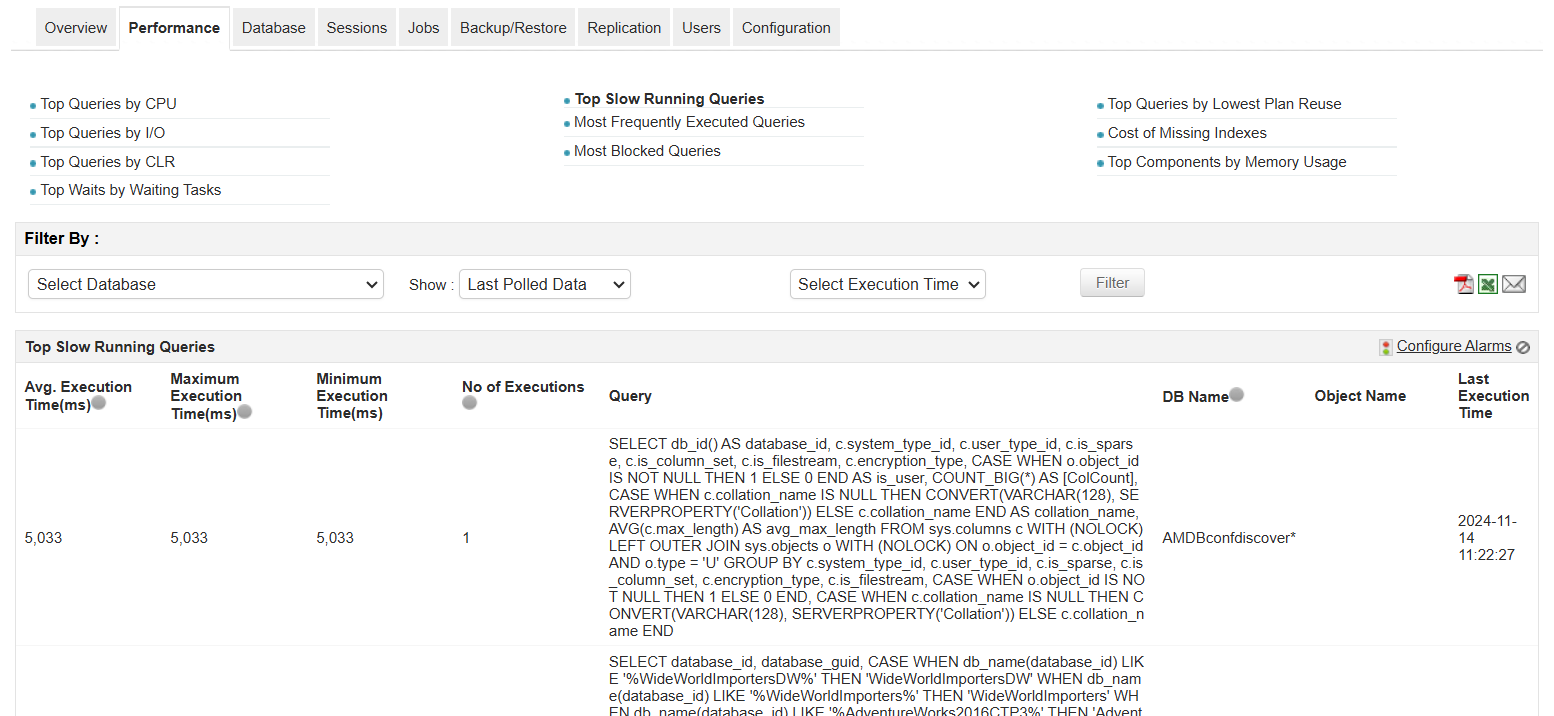
4. Query performance
Analyzing query execution times, wait types, and query plans helps pinpoint slow-running queries. Monitoring top queries by CPU, I/O, and execution time can reveal performance bottlenecks, allowing for optimization of indexes, execution plans, and query structures. Keep track of queries with low plan reuse to reduce the need for frequent recompilations.
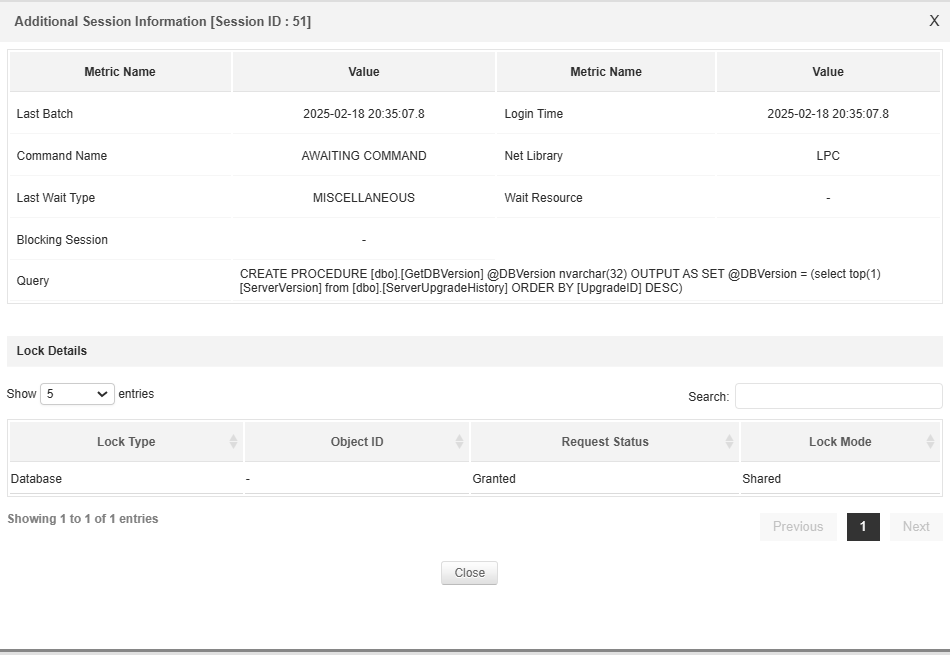
5. Blocking and deadlocks
Deadlocks occur when two or more queries block each other, leading to transaction failures. Monitoring blocked queries, deadlock occurrences, and wait statistics ensures smooth database operations by preventing resource contention and improving query execution efficiency. Analyzing execution plans associated with deadlocked queries can help identify potential optimizations.
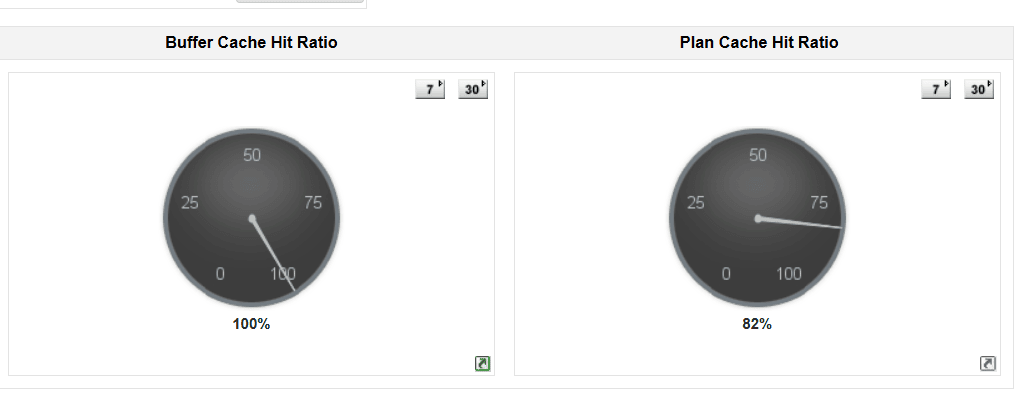
6. Plan cache hit ratio
A low plan cache hit ratio indicates frequent query recompilations, which consume CPU resources unnecessarily. Tracking this metric helps optimize execution plan reuse and reduces overhead on the database engine. High compilation rates, memory pressure, and frequent plan invalidations can contribute to poor plan reuse and should be addressed.
7. Database replication lag
In high-availability environments, monitoring replication metrics like synchronization lag (sync lag) and redo lag is crucial. Sync lag measures the delay between primary and secondary database synchronization, while redo lag tracks the time taken for transactions to be replayed on secondary databases. These metrics help ensure data consistency across replicas and prevent delays in failover scenarios.
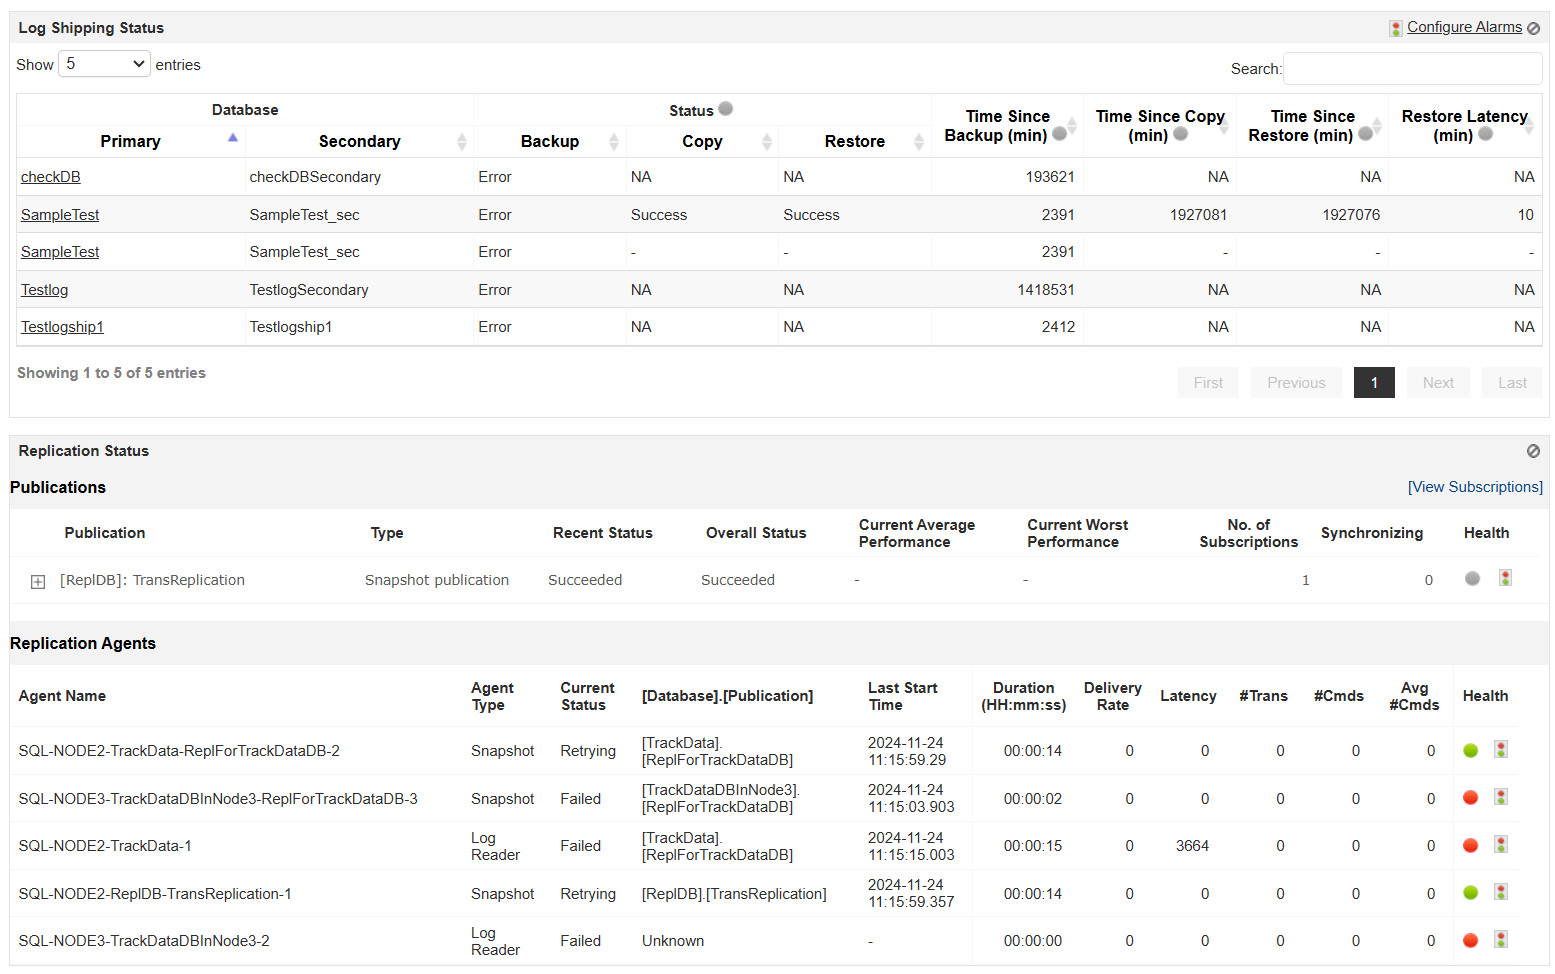
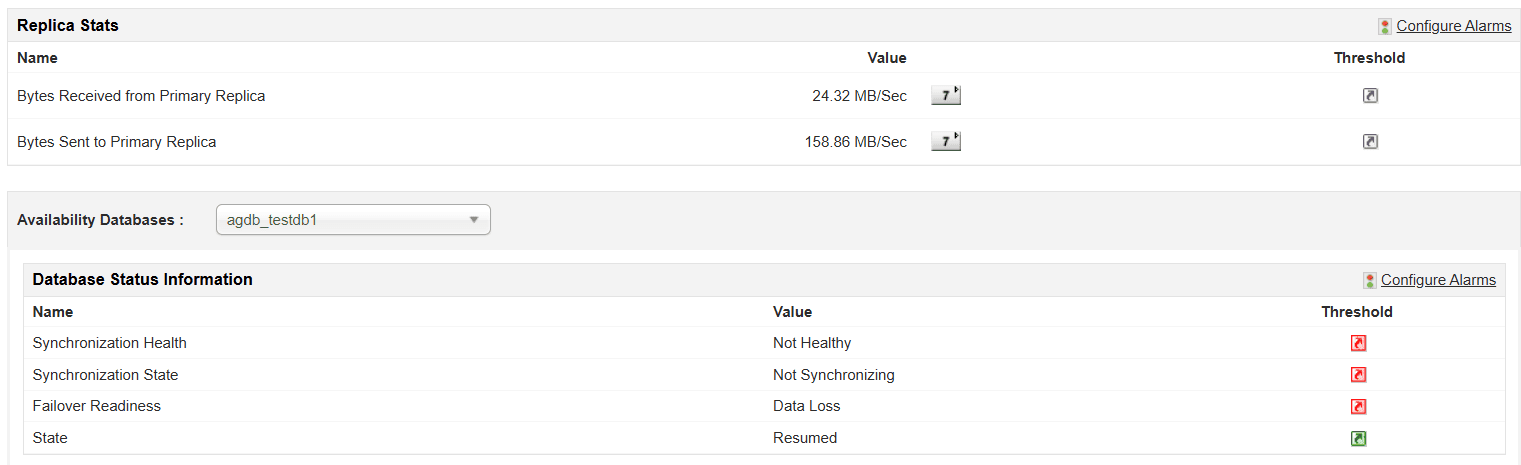
8. Always On availability groups
Monitoring Always On availability groups helps track the health of database replicas, failover readiness, and data synchronization status. Keeping an eye on the redo queue and the log sent queue ensures minimal data loss during a failover event. Additionally, tracking the status of database mirroring sessions and replication agents ensures uninterrupted data synchronization across multiple nodes.
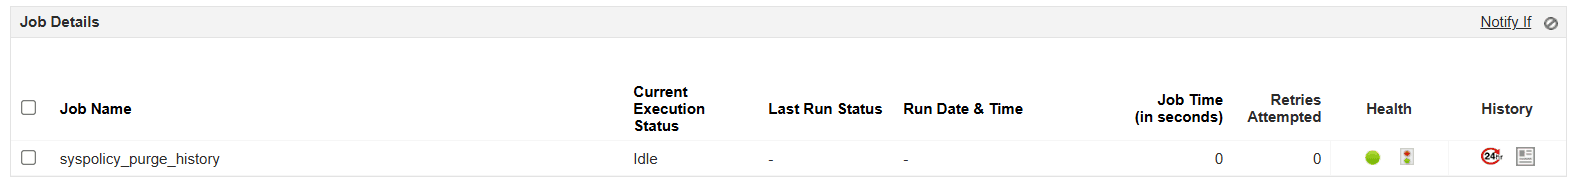
9. SQL job execution
Tracking scheduled job executions helps identify failures, long-running jobs, and irregular execution patterns. Timely alerts on job failures ensure critical maintenance and backup processes run successfully without manual intervention. Identifying patterns in job execution can help optimize resource allocation.
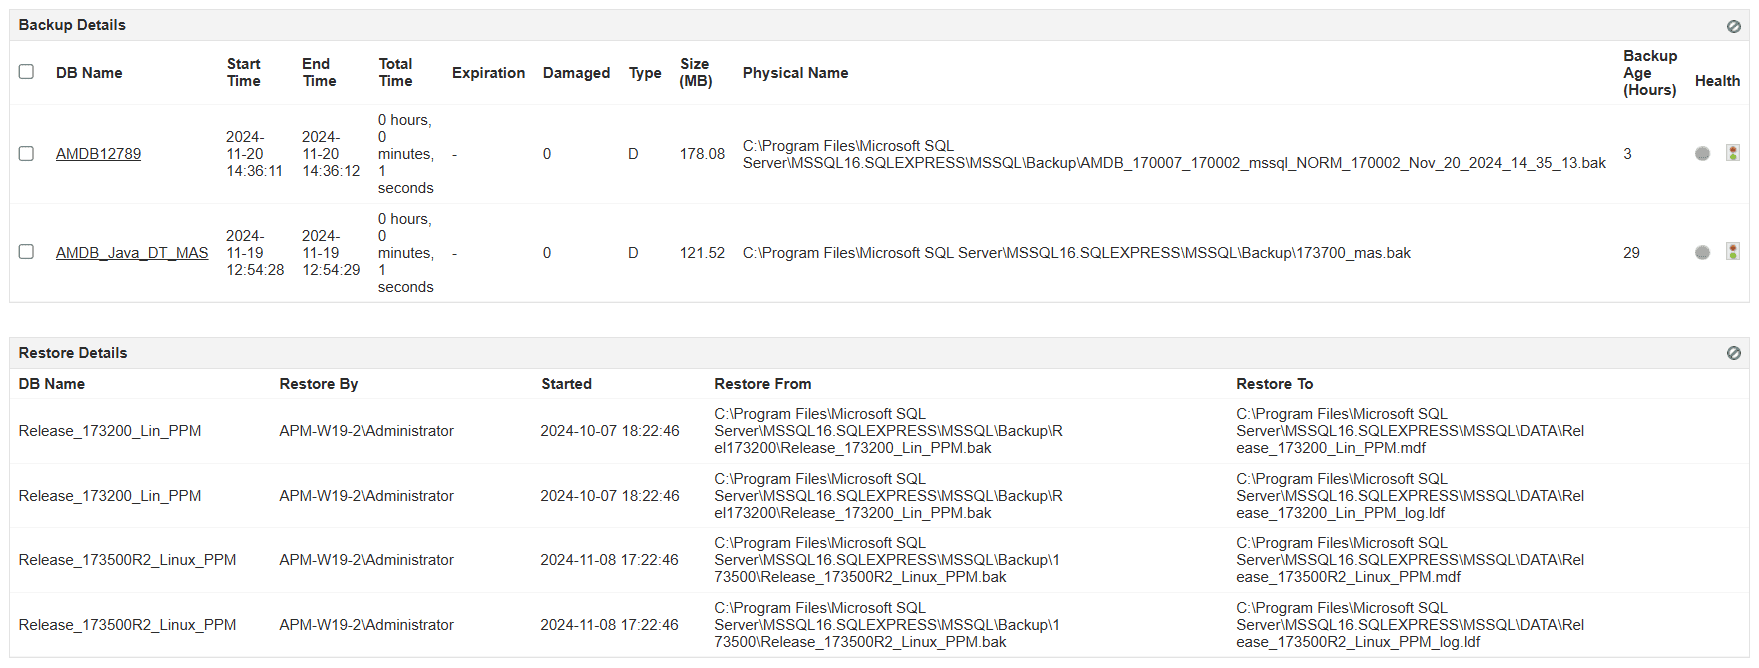
10. Backup and recovery status
Ensuring regular backups and monitoring backup job completion is vital for disaster recovery. Keep track of backup success rates, backup file integrity, and the age of backups to prevent data loss and streamline recovery operations. Detecting damaged backups early ensures data can be restored without complications.
While tracking each of these ten metrics is essential for maintaining database health, proactive monitoring goes beyond just observing performance. Automated alerts help administrators detect and resolve issues before they escalate, while predictive analytics can aid in planning for future resource needs. This is where ManageEngine Applications Manager can help.
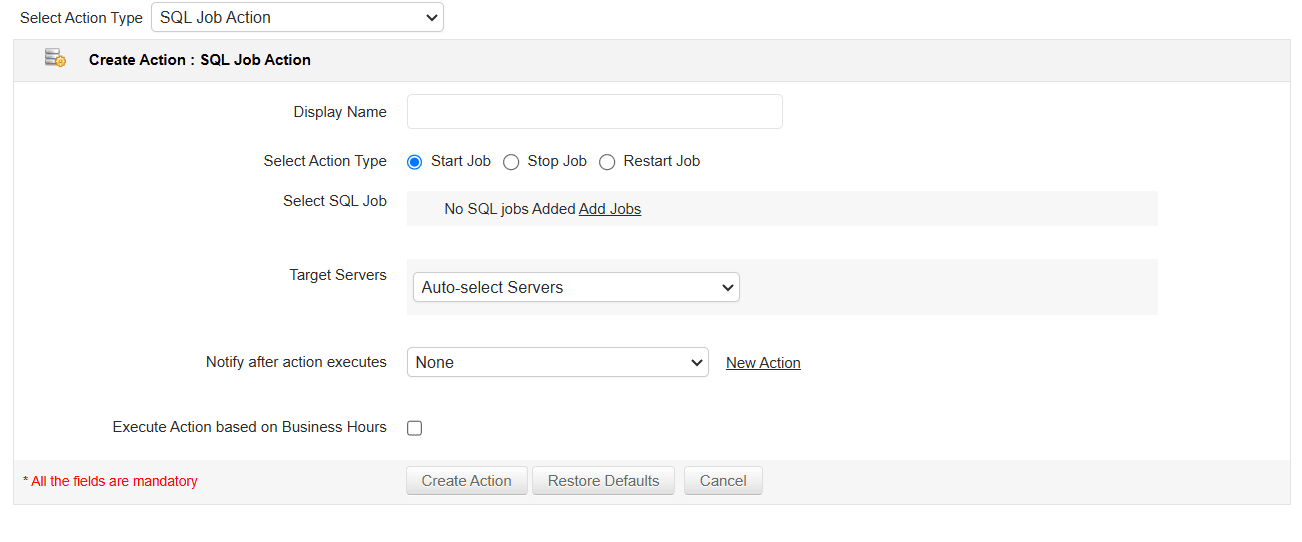
Intelligent alerting for proactive monitoring
Enable proactive issue resolution by setting up intelligent alerts in Applications Manager based on threshold breaches. AI-assisted anomaly detection can notify administrators in real time through email, SMS, or collaboration tools like Slack. You can even create and execute SQL job actions directly from the Applications Manager console and proactively respond to job failures.
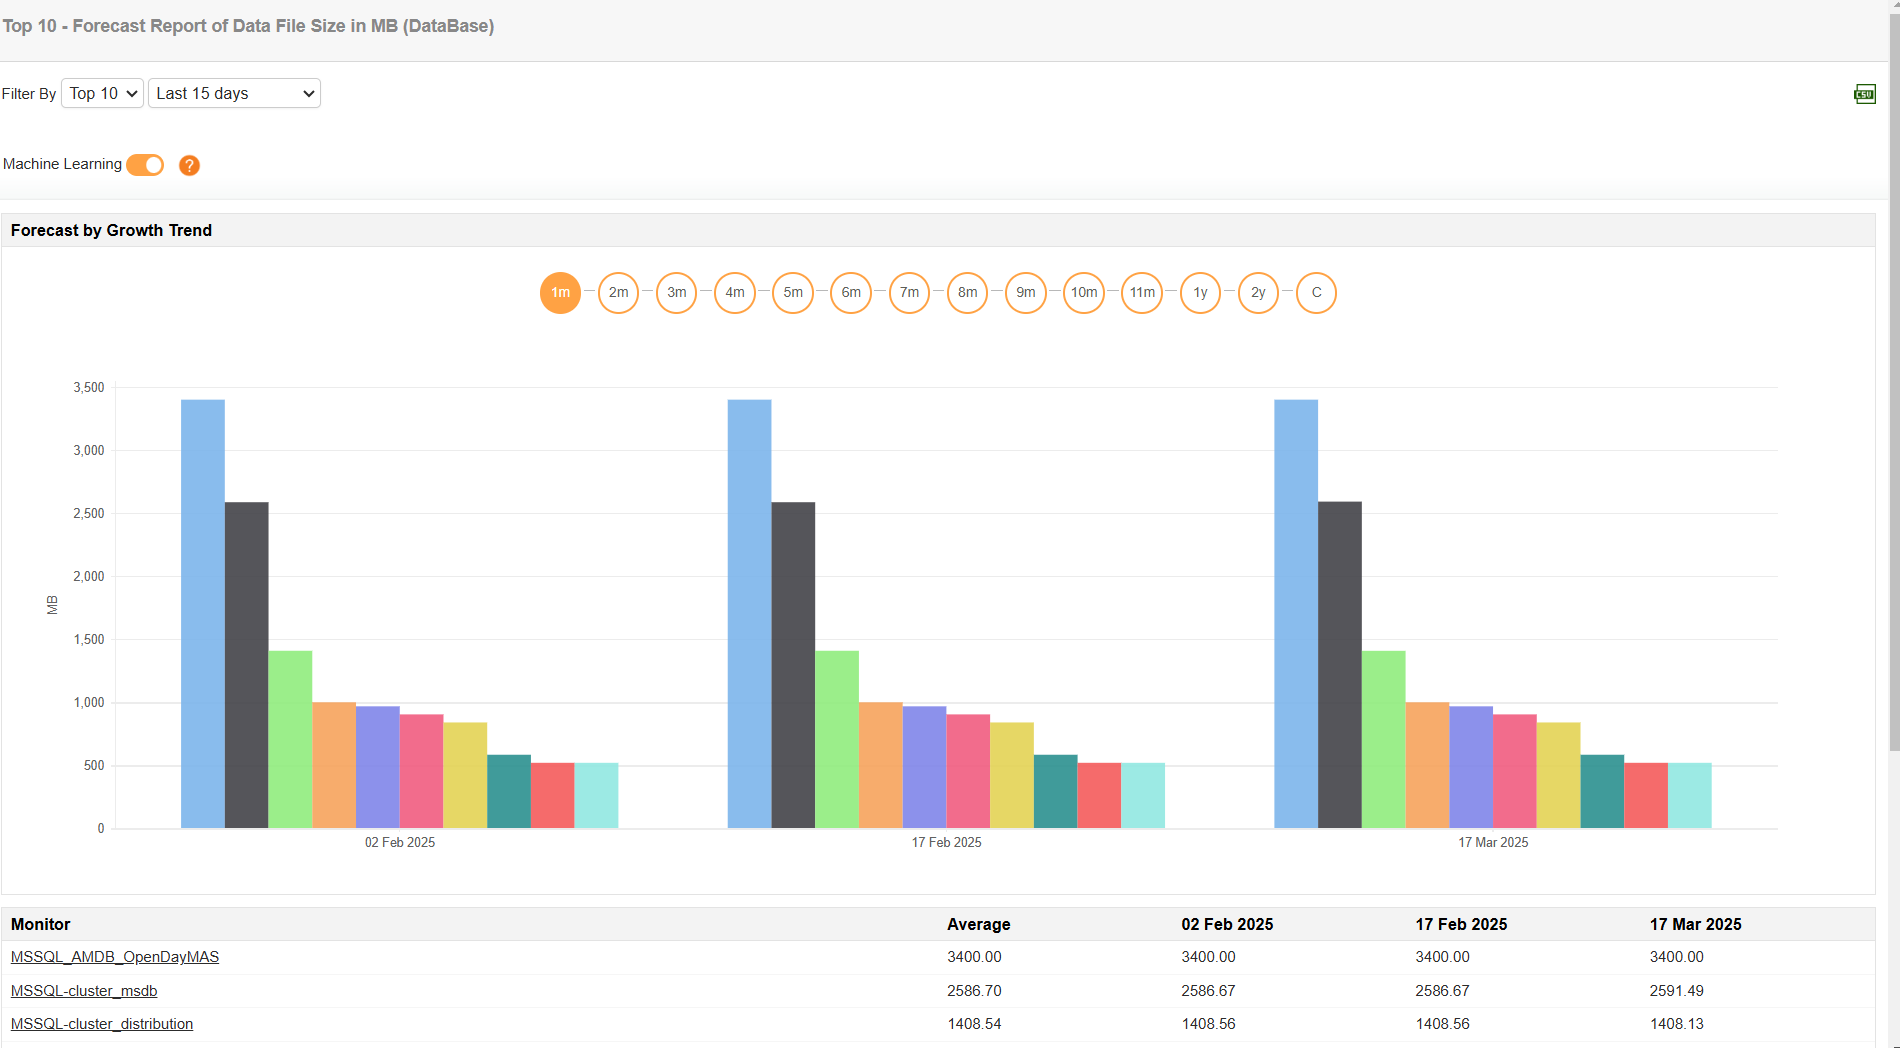
Forecasting storage needs
Using trend analysis and forecasting tools helps predict future storage requirements, allowing for better capacity planning and avoiding unexpected performance degradation due to insufficient disk space.
Conclusion
Monitoring these key SQL Server metrics ensures optimal database performance, reduces downtime, and enhances efficiency. Although there are native options, such as SQL Server Management Studio (SSMS), and built-in features like Dynamic Management Views (DMV) and SQL Server Profiler, many organizations opt for third-party monitoring solutions like ManageEngine Applications Manager due to advanced features, better UI, and comprehensive reports, as well as the professional technical support options.
Applications Manager simplifies SQL Server monitoring by offering real-time insights, proactive alerts, and AI-powered anomaly detection—helping database administrators maintain smooth and efficient operations. You can monitor Microsoft SQL Servers, regardless of whether they are running in Windows, Linux, or Docker containers, or hosted on Azure.
If you are new to Applications Manager, download a 30-day, free trial and start monitoring your SQL servers today!