Sometimes server or network administrators receive alerts for performance problems that eventually turn out to be false. Over a period of time, repeated false alarms can annoy administrators and force them to think of ignoring these alarms. However, there is every chance that one of these alarms may turn out to be true, so ignoring them is probably not a good idea.
Wouldn’t it be great if the monitoring product itself could suppress false alerts and show only genuine ones? Let us find out how you can suppress false performance alerts in Applications Manager with a couple of examples.
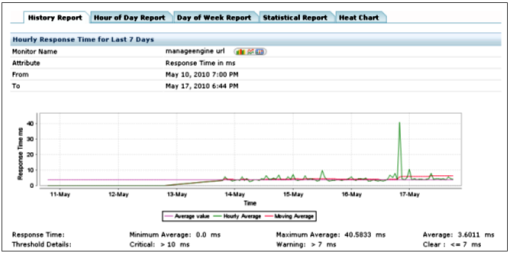
Example 1: An external URL is monitored every 5 minutes and the response time is reported as 3000 ms, whereas the average response time of the URL is 250 ms. The administrator can configure thresholds for response time, generate an alarm when the response time is greater than the threshold value and create email or sms actions for alarm notifications. However, it is once or twice in a day that the URL response time reaches 3000 ms due to excessive bandwidth usage. The administrator knows that the peak hour traffic is attributed to the huge response time of the URL and receives an email alert on the response time threshold violation. In order to suppress this known alert, the administrator can configure the ‘Polls to try’ option globally or for individual monitors.
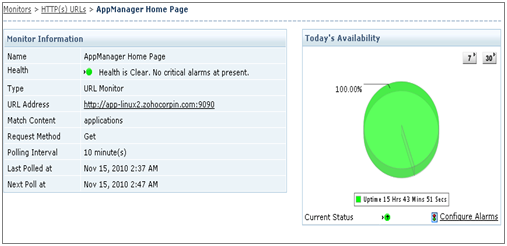
Here are a few screenshots that show the availability and response time of the url:
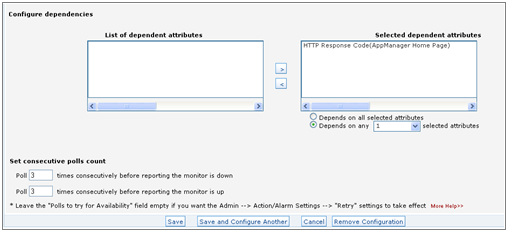
You can click Configure Alarms -> Show Advanced Options to set consecutive poll count in order to report a monitor is down. This is the ‘Polls to try’ configuration for Availability.
In order to set this option globally for all monitors, use Admin -> Action/Alarm Settings.
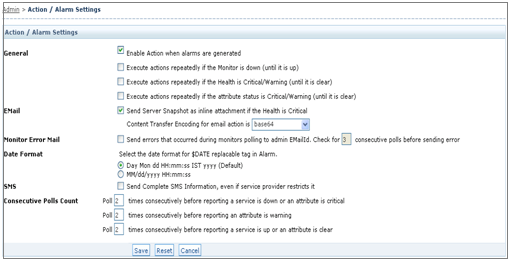
Here is a screenshot which shows how to configure the ‘Polls to try’ for response time threshold values, globally.
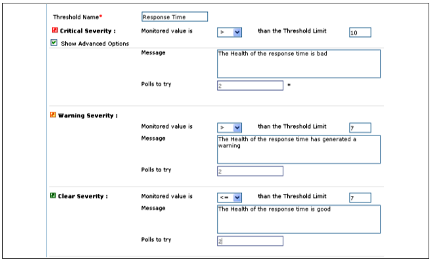
Such configurations are also possible for the HTTP(s) URL Sequence monitor and the Real Browser Monitor.
Example 2: The Memory Utilization on a server may report transient spikes for various reasons. Such alarms, when generated due to threshold violation, can be curbed down through the ‘Polls to try’ configuration. You can set the ‘Polls to try’ option as shown above in the screenshot of Response Time Threshold.
Can you think of any other ways to improve alarm management in Applications Manager? Let us know your comments.