Our previous blog on advanced security analytics module would have given you a general idea of what ASAM does, pre-requisites for ASAM module and more.
Now this blog will help you understand the new dashboard available for the security analytics module. This version of security analytics in NetFlow analyzer has the dashboard with four different reporting options.
The different reporting options are as follows:
1) Security Posture
2) Problem Analysis
3) Offenders & Targets
4) Resource Analysis
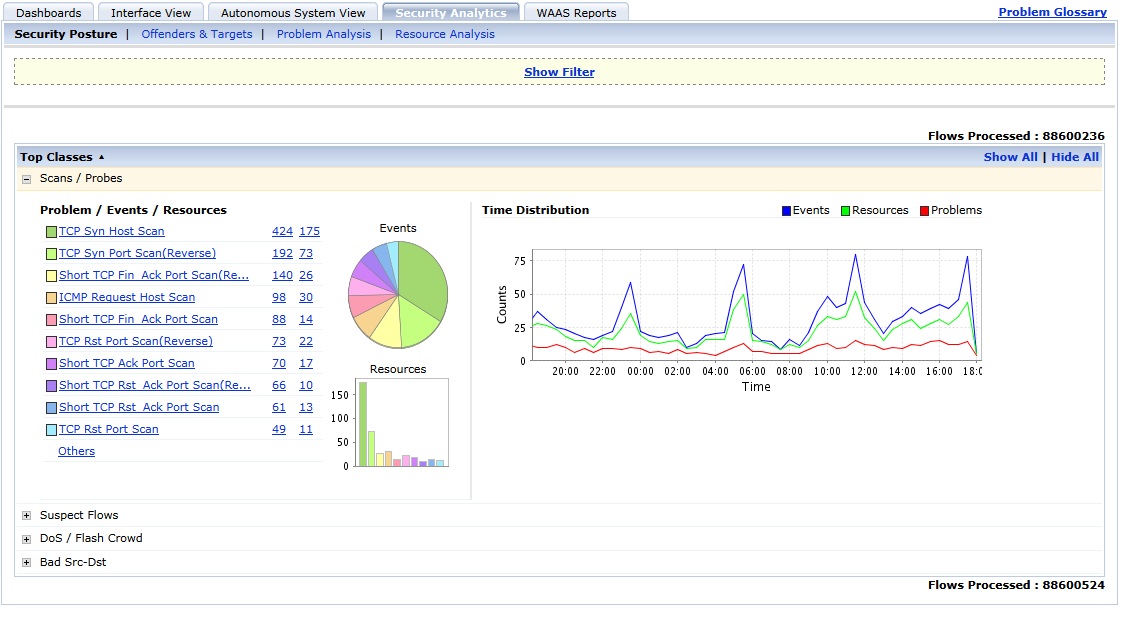
Security Posture :-
Displays the top problem classes and their composite sub-problems. It also lists the number of events and unique resources involved for each problem. Click on the problem name or the number of resources beside the problem to go to the problem analysis tab. You can also click on the number of events beside the problem name to directly shift to the Event list page. From the event list page you can start troubleshooting the Network.
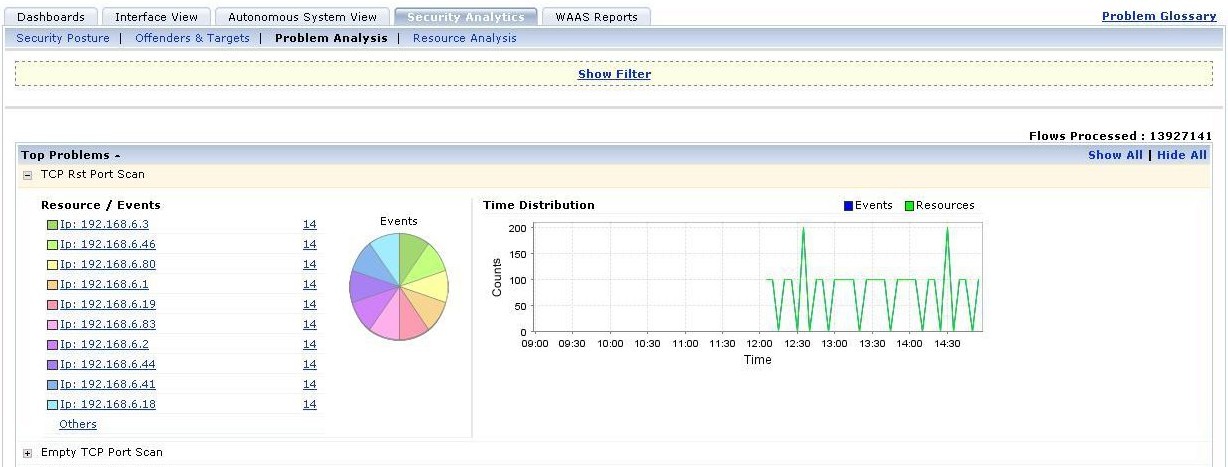
Problem Analysis :-
Displays the top problem names and the unique resources involved. It also lists the number of events and the problem caused by a specific resource.
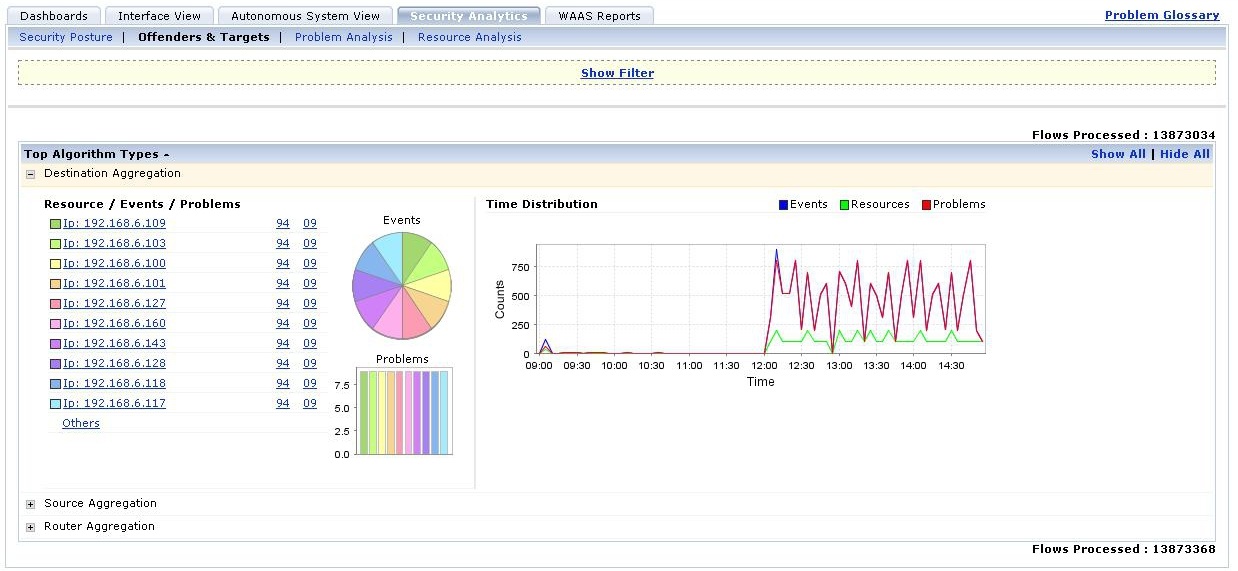
Offenders & Targets :-
Displays the top algorithm types and the unique resources involved. The algorithms available in this version of NetFlow Analyzer are destination based aggregation, source based aggregation and router based aggregation.
This Offenders & Targets report also lists the number of events and distinct problems. Click on the resource name or the number of problems to go to the resource analysis tab.
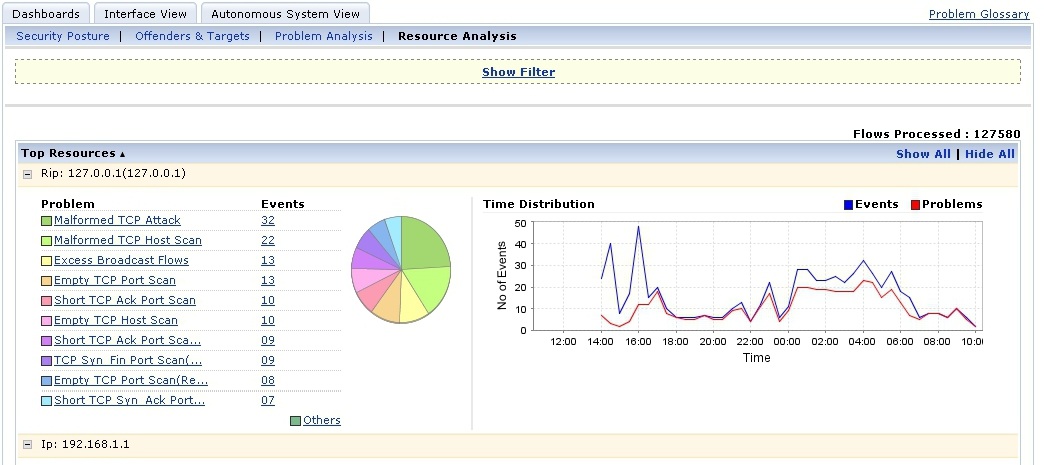
Resource Analysis :-
Displays the top resources and the problem. It also lists the number of events of the problem caused by each resource.
We also have the filter options for all the above mentioned reports in dashboard. we can apply filters through which we can generate all the four reports based on specific criteria which depends on what we would like to identify. A given set of parameters and thresholds are completely configurable which provides flexibility to choose the depth at which we would like to analyze our problems.
Click on the “Show Filter” button to view the filters.
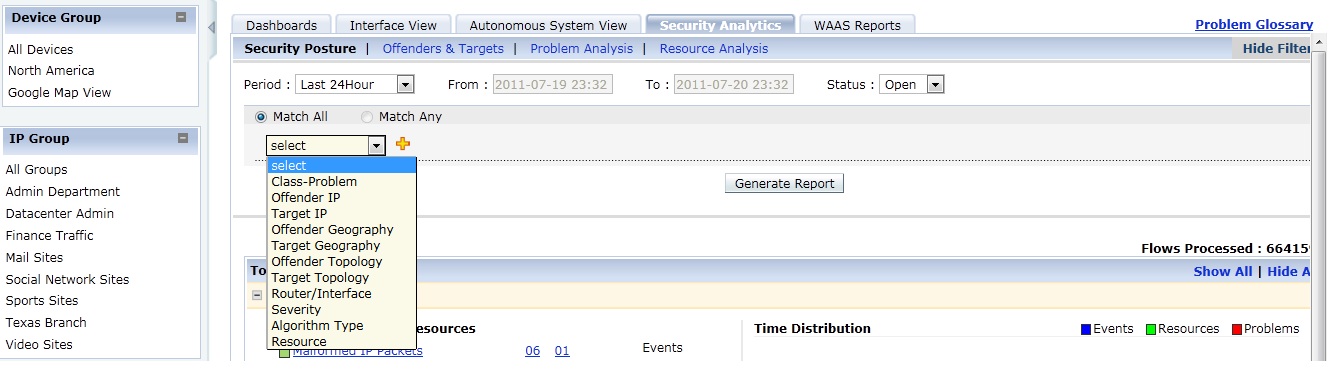
You can filter the events based on:
1) Period: For any selected time period from last hour to last month. The custom time option can be used to generate reports for a specific time period.
2) Status: Denotes the status of the event on whether it is open, closed, or ignored. You can also choose “all” to select all the available events.
You can also choose to match all or any of the filter criteria, given below a screenshot of the filters.
How events are triggered for the security event – “scans/probes” is explained in our next blog on ASAM.
You can download the 30 day trial from here.
Praveen Manohar
NetFlow Analyzer Technical Team