We are glad to present some screenshots of our new UI. You would be able to view the new UI in our upcoming edition.
To give the users an improved usability and a better user experience has been the primary intention to revamp the User Interface.
Some changes that would help you use NetFlow Analyzer better have been explained in this blog post.
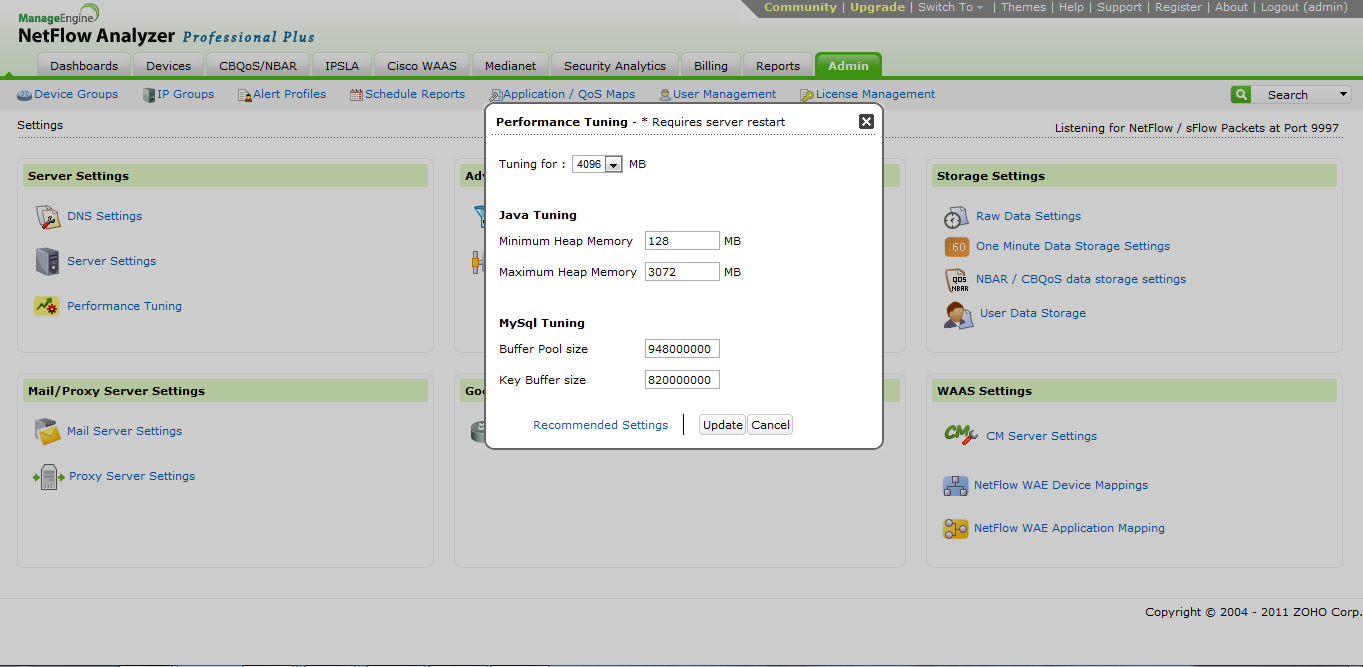
1) Performance tuning at the UI level:
You could fine tune the performance according to your preferences and your environment from the ‘Admin’ tab itself.
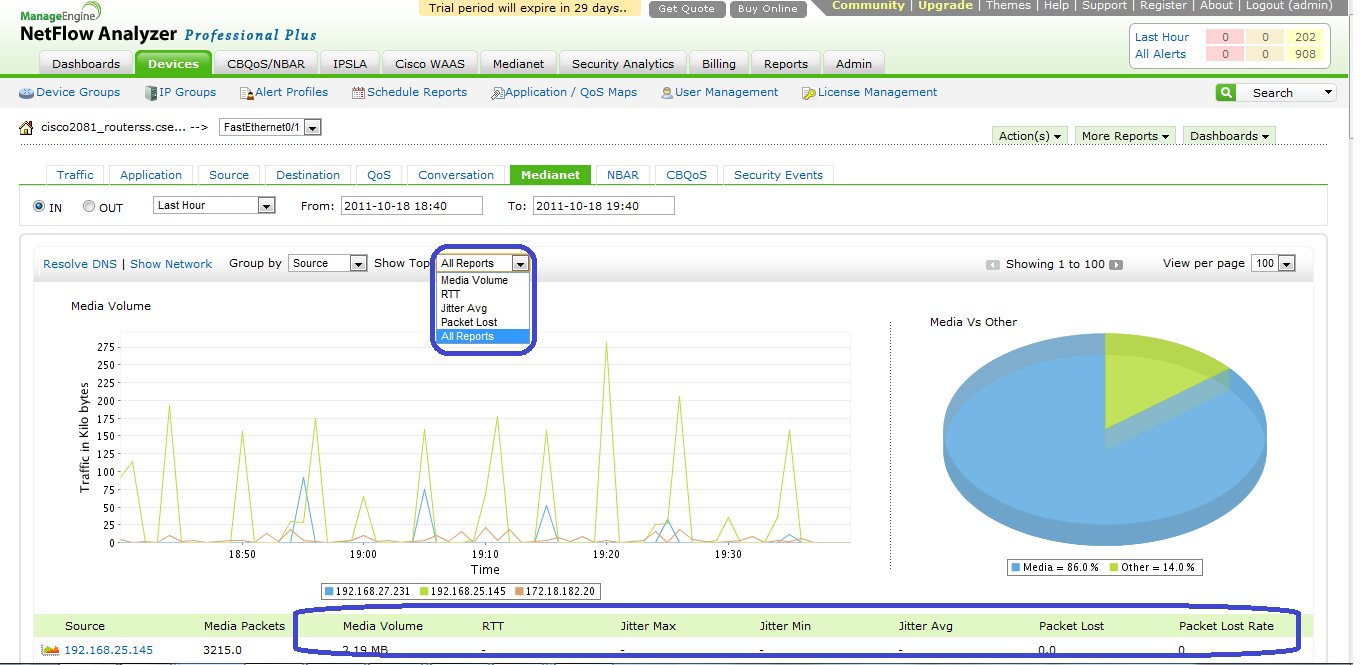
2) Medianet reports:
These reports help you view the video traffic in your network. The comparison between media traffic to other traffic would know how much traffic volume in your network is in the form of videos. With the entire nature of network communication switching to video calls & video conferencing, this feature would make your future in traffic monitoring much more easy, simple & effective.
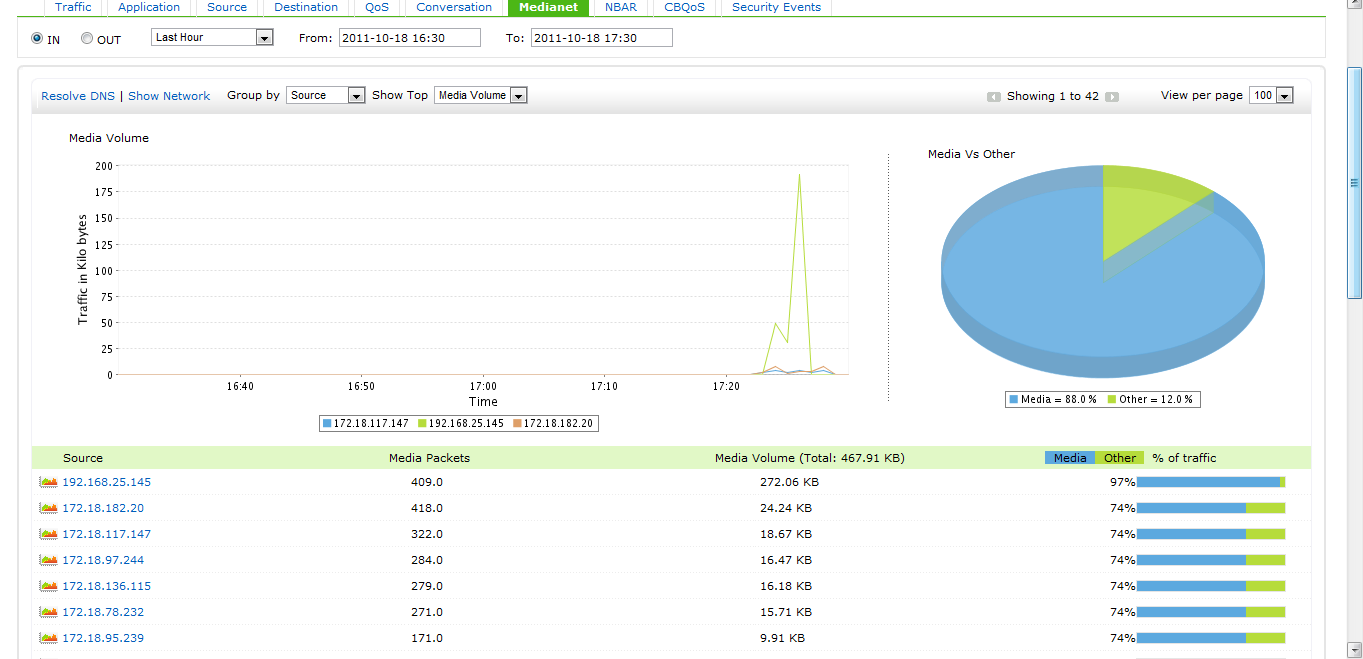
You could get vital information like jitter, packet loss, Round Trip Time etc. about your media traffic:
3) Grid view
The grid view helps you get better views on the monitored entities than a tabular view & it minimizes the number of scrolls & clicks a great deal. The grid view also categorizes the devices based on the type of flow it exports like sflow, NetFlow etc.
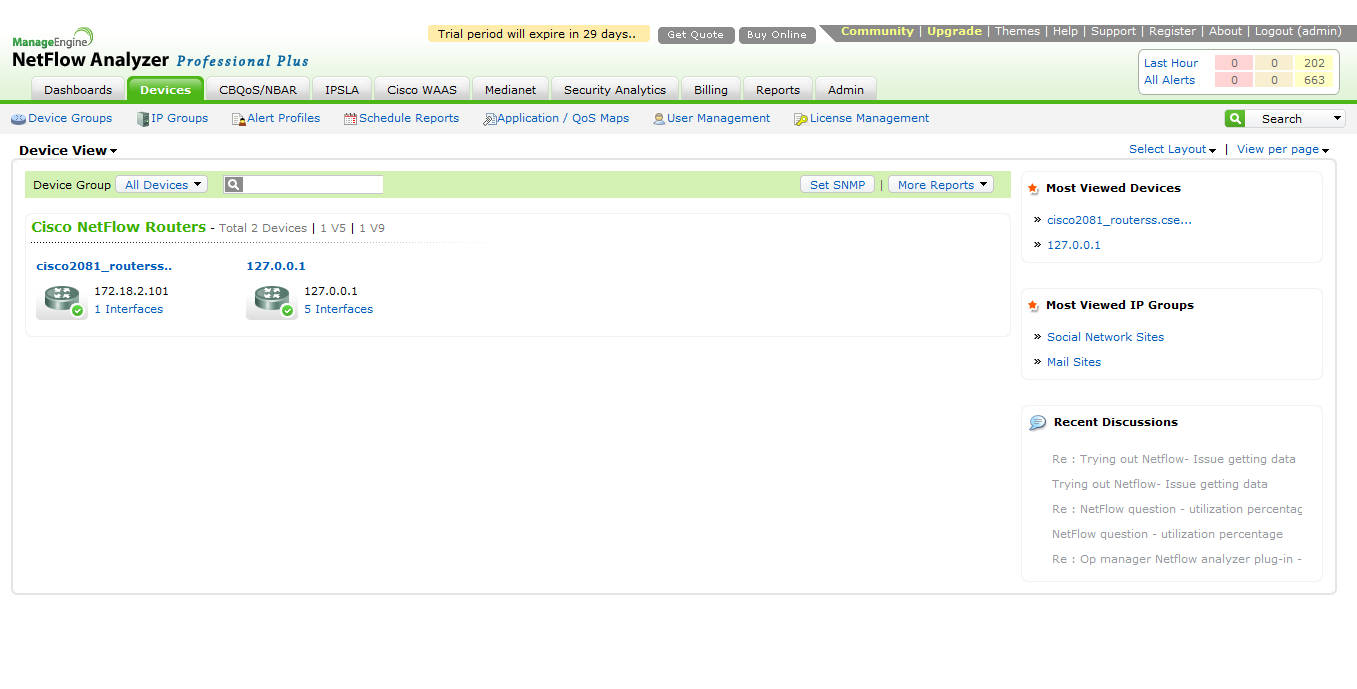
In the above screen capture, you could also see the most viewed devices and the most viewed IP groups on the right pane.
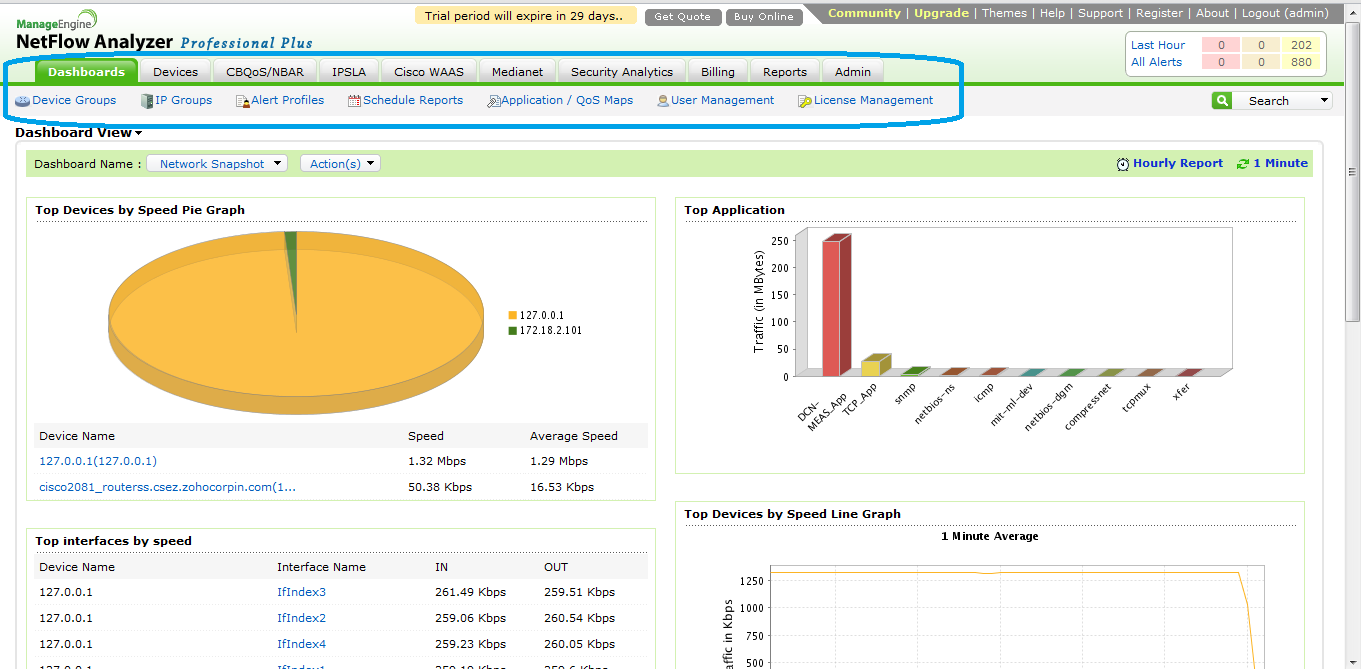
4) Tabbed view
The tab view in the new User Interface is a highlight as it would help you look at anything that you may want by simply switching to that tab. This helps you in easy navigation plus it also eases your drilling down options a great deal. You will have to click your mouse at least 50% lesser to get the views that you want.
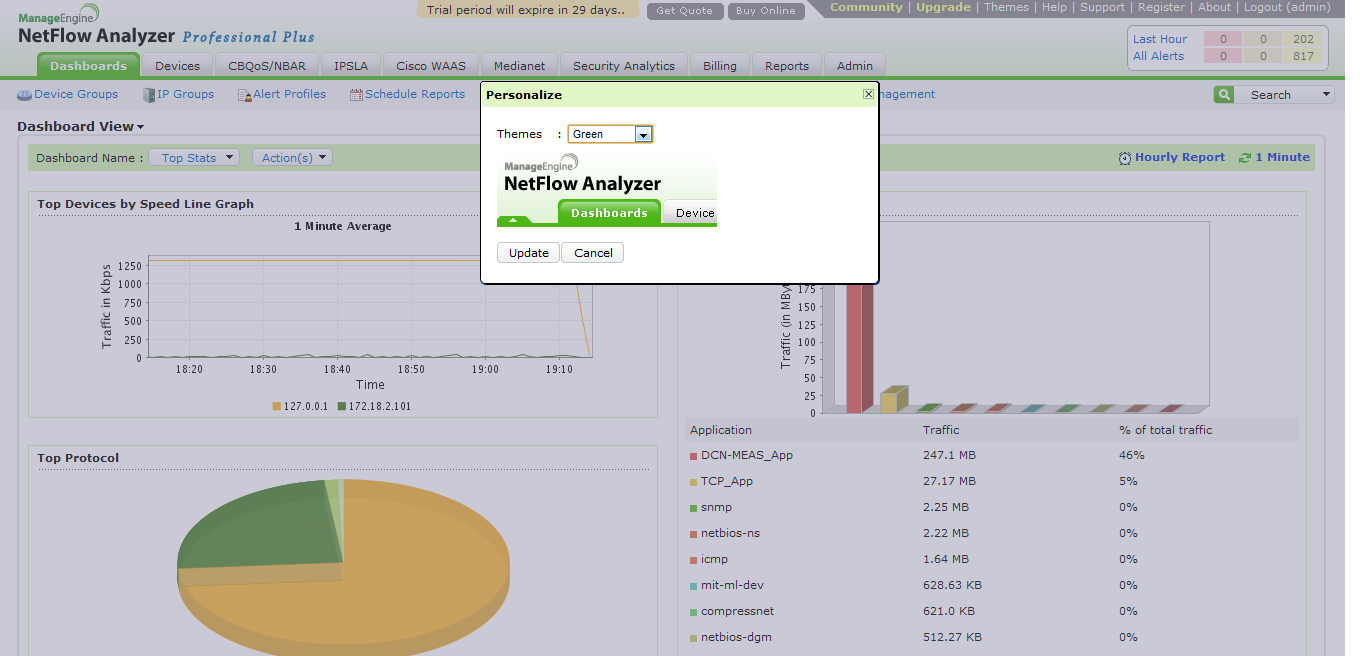
5) Personalize
User experience is of foremost importance and we would like to let you choose your own themes among the available. That would enhance the feel & enable you have an enjoyable experience using the product to monitor. After all, it makes your work very colorful(literally!)
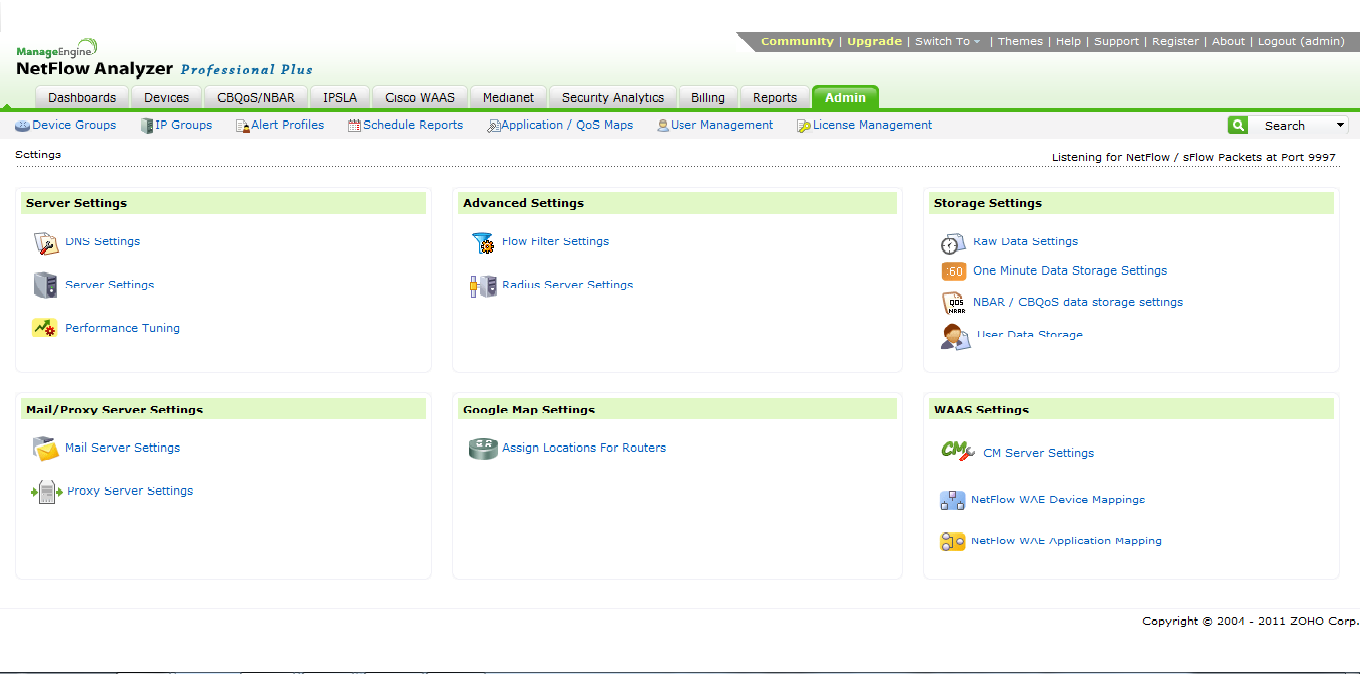
6) Admin operations:
The ‘Admin’ page gives you a tab view of all the Admin operations that you could do. It would act like a single window to administer your entire network monitoring settings.
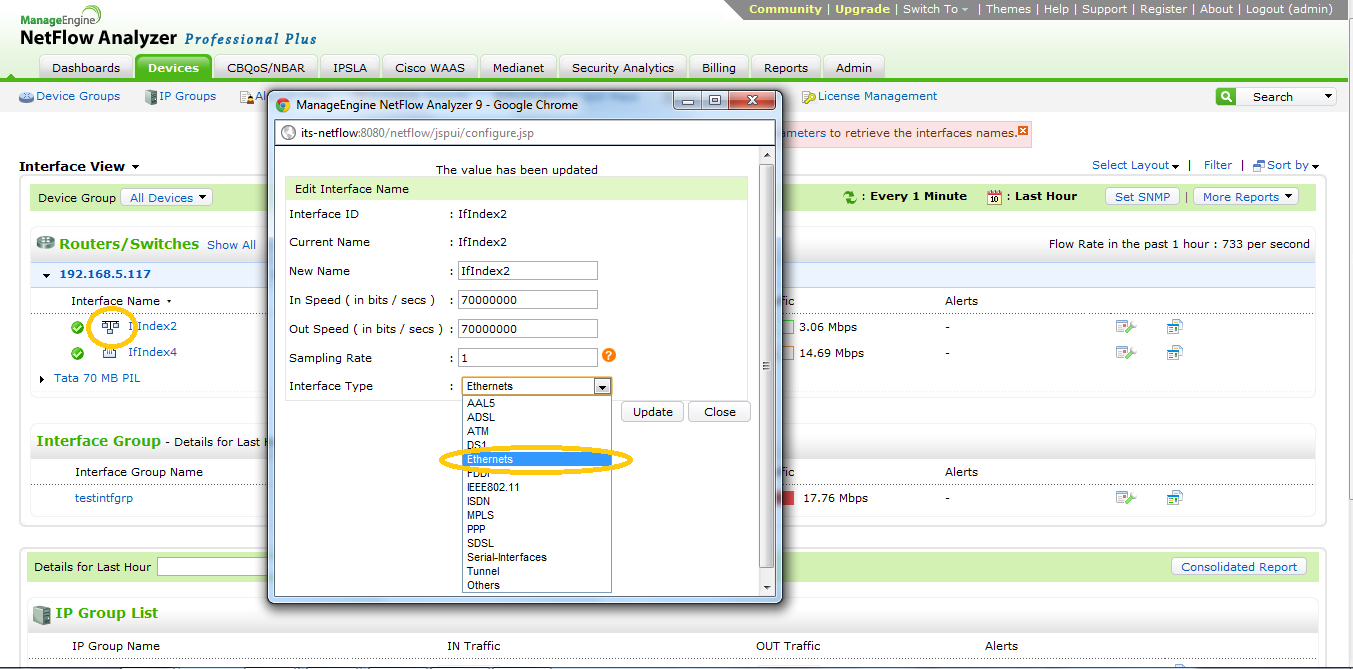
7) Interface type – Icon:
Another feature that would help you is to see icons for the interface type depending on what it is. This would help you identify the interface type easily with just one glance.
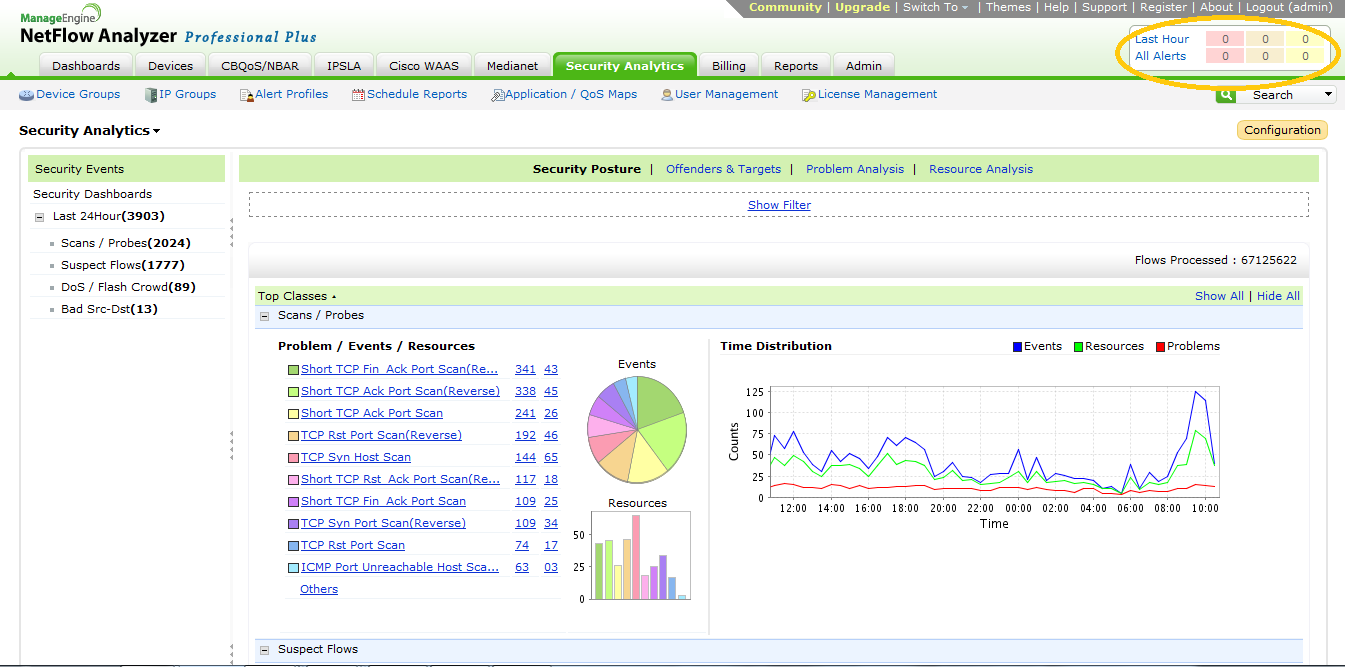
8) Alert profile – Quick view:
You could take a quick glance at the alert since it is present on the top right corner for you to view it easily.
This would help you to have an enriched experience and network bandwidth monitoring is now really made easy.
Regards
Sai Sundhar Padmanabhan