If you use or are evaluating NetFlow Analyzer, you may want to know how the product stores its data and carries out historic reporting.
NetFlow Analyzer processes the NetFlow data exported from devices and stores it in the database for traffic analysis and reporting. NetFlow Analyzer’s flexible data storage pattern is intended to achieve detailed data storage with no limit on the age of stored data and no impact on hard disk space, all while providing real-time reporting.
Data stored on NetFlow Analyzer will help you with:
- Troubleshooting network spikes.
- Capacity planning.
- Historical reporting.
- Billing.
- Analyzing trends.
- Understanding traffic patterns.
- And much more.
NetFlow Analyzer stores two types of data: raw data and aggregated data.
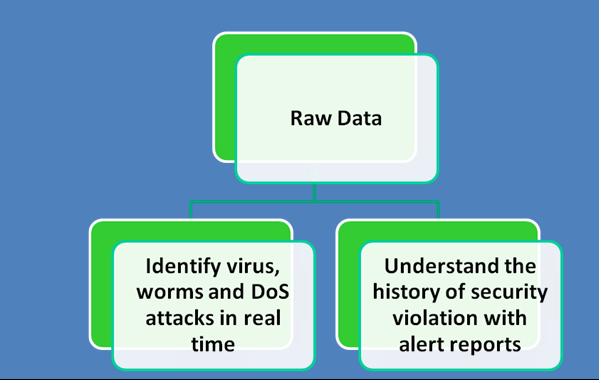
Raw data storage
Raw data is each and every flow exported from the monitored interfaces of the routers. All the flows exported from the routers are stored in the NetFlow Analyzer database as raw data. Raw data consumes a lot of disk space and is therefore set to be stored for a maximum of 30 days. Raw data storage is determined by the amount of flows the product receives from the monitored routers. To make calculation easier, the product itself can suggest how long you can store raw data based on the free space available in the installation directory and the flow rate.
Raw data storage can be configured in NetFlow Analyzer by clicking Product Settings > Storage Settings > Raw Data Storage. There are also options available to alert you and automatically delete older raw data when disk space falls below a specified percentage.
Raw data is used in the product when generating troubleshooting reports, and reports on the last two hours will be generated from raw data. Raw data has complete port-level information that helps in detailed analysis of traffic.
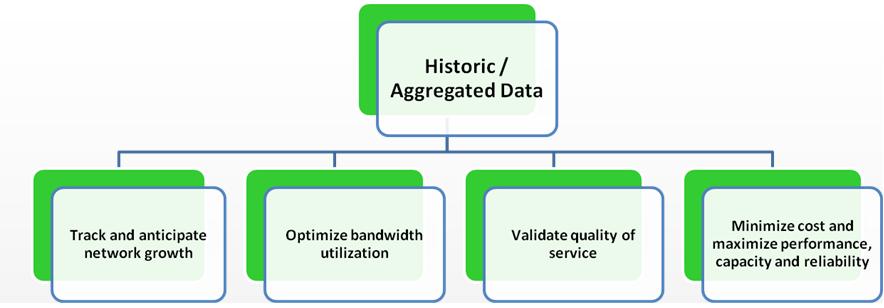
Aggregated data
Apart from the raw data storage, NetFlow Analyzer stores aggregated data, which is stored indefinitely in the database. The aggregation mechanism will happen simultaneously at the back end along with the raw data storage. The aggregated data is stored based on the top 100 fields of the application and conversation for every 10-minute interval and is further aggregated as time goes on.
The aggregation of NetFlow data collected is done to avoid high disk space usage or any impact on reporting and performance. The aggregated data on NetFlow Analyzer is used for historical reporting, capacity planning, and trend analysis.
The following image will help you understand how application data in NetFlow Analyzer is aggregated and stored in various tables.
Aggregation mechanism for application data
Older data is repeatedly rolled up into less granular times (10 minutes, one hour, six hours, 24 hours, and weekly). The top 100 records of applications based on octet value are stored for every 10-minute interval. As time passes, this data is further aggregated to an hourly table.
When we select the time period of 10:00 to 10:59, NetFlow Analyzer stores the top 100 applications for every 10 minutes (10:00, 10:10, 10:20, 10:30, 10:40, and 10:50), and this data will be collected under the 10-minute table. From these six 10-minute data collection times, the 600 records pertaining to these time slots will be aggregated, and the top 100 will be moved to the one-hour table pertaining to 10:00.
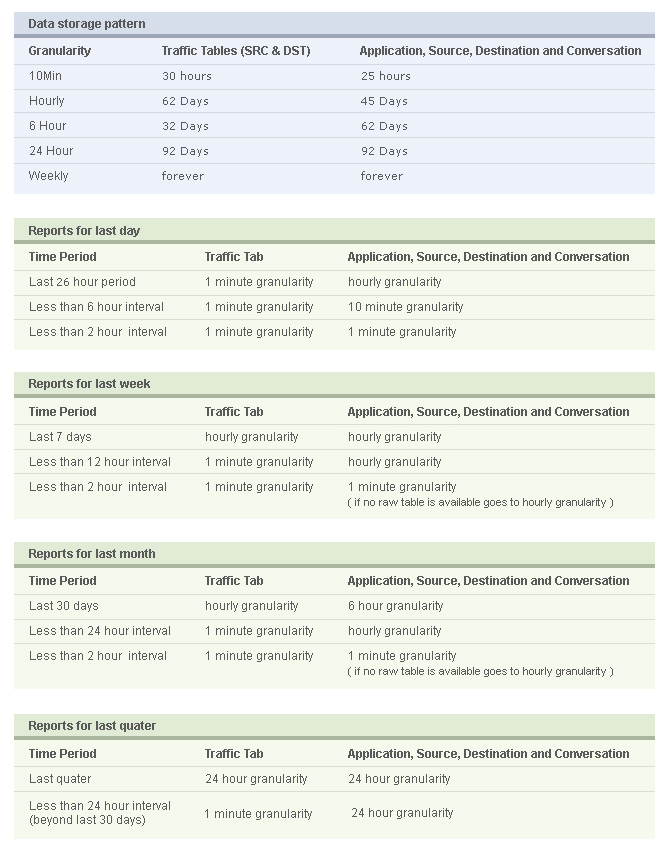
This same process is followed for the hourly table, and data is moved to the six-hour table, then to the daily table, and finally to the weekly table. The most recent data is stored with 10-minute granularity, and data older than 92 days is stored with one-week granularity.
The 10-minute table will have the most recent data, and data older than 25 hours is cleaned up. This is how data is repeatedly rolled out:
- 10-minute granular data is stored for 25 hours (beyond which older data is deleted).
- One-hour granular data is stored for 45 days.
- Six-hour granular data is stored for 62 days.
- 24-hour granular data is stored for 92 days.
- 1-week granular data is stored forever.
In the same way as applications, conversations are also aggregated and stored in the database for historic reporting. The Application, Source, Destination, Conversation, and QoS reports generated for periods of more than the last two hours will be generated from the aggregated data. The granularity of data represented will change based on the time period you select.
One-minute traffic data storage
Apart from the raw data and aggregated data, NetFlow Analyzer stores one-minute traffic data, which is used for real-time reporting purposes. The aggregation mechanism for the traffic data is carried out the same as with application data. The traffic report generated for any time period less than 24 hours is generated with one-minute granularity, which will give you a detailed picture of each and every transaction going in and out.
One-minute data storage can be configured in the product by clicking Product Settings > Storage Settings > One Minute Data Storage Settings.
I hope this blog gives you a better understanding of the data storage patterns in NetFlow Analyzer and will help you use the product better.

Hi Praveen, we have set One Minute Data Storage to one year, but I’m not sure which table hold this info in the database. DstIf1Min and SrcIf1Min don’t have anything in them. Where do I find all the one minute data?
Or, is there a way to hold onto the 10 minute data longer?
Thank You!
Hello,
I have installed the Netflow Analyzer, and after I did a reboot of the server where my Netlfow is, I can´t find any historical data of my flows, I only have the data since I rebooted my server. Could you help me to find where it goes? Or maybe where it is suppose to be.
thanks in advance
J. Paredes
Hi,
This is unexpected behavior, please email us with your contact details to nfs@manageengine.com, we will call you and assist you.
Hi Logesh,
NetFlow Analyzer hard disk space consumption is purely based on the flow rate which you are receiving. If the flow rate is high then you need more HDD space. To reduce the database size, please navigate to Product Settings —–> Storage Settings and change the retain raw data value to some minimal value. Raw data is the one which consume huge disk space.
HI,
I am getting the below alert from netflow, can you kindly suggest how to take backup of the old data or how to overcome this…
———————————————————————————————–
Dear Administrator,
This is an automated mail generated by the ManageEngine NetFlow Analyzer, to inform you of following event.
***************************************************************************************
Message : Available free space in your hard disk is less than 20%
***************************************************************************************
Kindly take note of this.
Thanks
NetFlow Analyzer
—————————————————————————————————————————–
Thanks in advance…
Regards,
Logesh R