Myriads of applications run businesses worth billions of dollars today. Thousands of network components support these business-critical applications and hundreds of sites are dependent on them. All this sums up to create a complex architecture which is beyond the imagination of a common man who just wants his application to be live all the time. For example, look at the recent high profile RIM outage which affected millions of users, who were kept in dark for four continuous days, worldwide. One definitely doesn’t want to be in such a situation in their business. The lesson we should learn from the RIM situation is how proactive an IT system should be to handle a crisis effectively while giving end users minimum downtime or taking things to the next level to ensure that users are least affected. The key question, however, is how can you avoid outages like RIM and keep your applications available all the time?
Today performance-management applications have become the most critical aspect for any IT-management department. Engineers work round the clock to make sure that applications are live 24×7. Despite of all their efforts there are times when outages take place. Are engineers to blame for this? Are these incidents inevitable? I would say NO to both these questions.
When we run applications in complex environments we also need tools that give visibility to what’s happening in those applications and other underlying components on a real-time basis. Such requirements gave rise to the need for real-time IT. No, I am not proposing a new marketing jargon here. We already have enough of those to bother with a new one! Let me explain what real-time IT is, with a diagram.
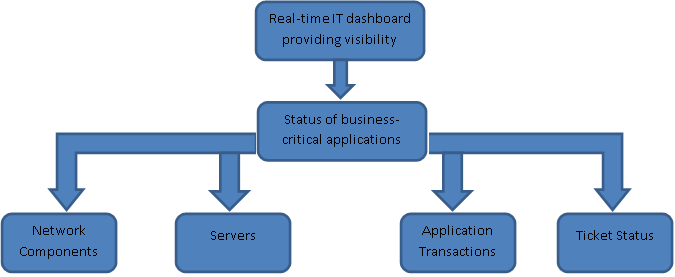
In the research report, “The Value of Integrating Availability and Performance Management and Service Desk Tools”, Gartner wrote that “Today’s business demands quality of service, application availability managed to service level agreements (SLAs), and agility which relies on higher degrees of IT operations efficiency.” This is exactly what I am trying to explain using the diagram given above-the visibility into service management from the same performance-management console.
Lets understand how visibility into real-time IT helps IT to operate at the speed of new businesses. As illustrated in the diagram given above, as long as you have a dashboard that keeps engineers updated about what’s happening in the underlying applications it’s easy to find the component that is malfunctioning and fix it before it causes an outage.
From our recent studies on the load an APM tool takes to run business-critical applications I believe it is essential to implement the following five integration-strategies which was even approved by recent Gartner research. We are taking a deeper dive in to these 5 dimensions in an APM Digest blog, click here to read
- End-user experience monitoring: Capturing data about how end-to-end application availability, latency, execution correctness, and quality appear to an end user.
- Runtime application architecture discovery, modeling, and display: The discovery of the software and hardware components involved in application execution and the array of possible paths across which these components communicate to enable that involvement.
- User-defined transaction profiling: Tracing events as they occur among components or objects as they move across the paths discovered in the second dimension. This is generated in response to a user’s attempt to cause the application to execute what the user regards as a logical unit of work.
- Component deep-dive monitoring in application context: Fine-grained monitoring of resources consumed by events occurring within the components discovered in the second dimension.
- Analytics and Application Performance Management Database (PMDB): Marshaling techniques, including behavior-learning engines, Complex-Event Processing (CEP) platforms, log analysis, and multi-dimensional database analysis discover meaningful and actionable patterns in the typically large datasets generated by the first four dimensions of APM.
We have released an e-book on the evolution of real-time IT. This e-book also includes a research report from Gartner on “How to Augment APM with Conventional Monitoring.”.Click here to download the report for free.