ADAudit Plus | October 31, 2025CVE-2025-59287 (RCE) turns WSUS into an attack vector: Track suspicious process behavior using ADAudit PlusCVE-2025-59287 in a nutshellA critical remote code execution (RCE) flaw (CVE-2025-59287) affects Windows Server Update Services (WSUS).Attackers can...
Endpoint Central | October 31, 2025HIPAA Security Rule updates: A proposed 15‑day patch mandate for critical vulnerabilitiesHealthcare is facing a new urgency curve. Proposed updates to the HIPAA Security Rule for 2025 include a...
General | October 30, 2025Top tips to integrate AI into your digital transformationTop Tips is a weekly column where we highlight what’s trending in the tech world and share ways to stay ahead....
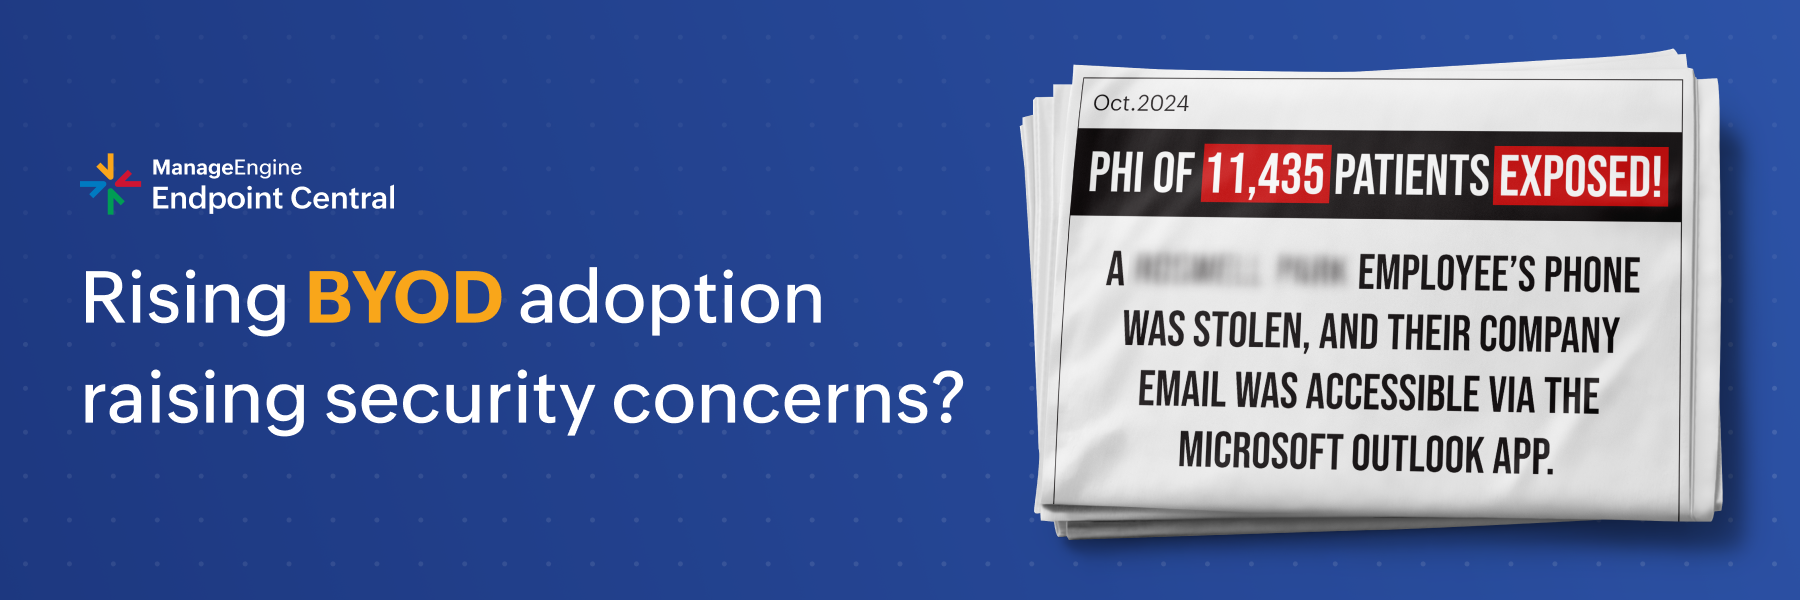
Endpoint Central | October 29, 2025BYOD management for privacy-conscious healthcare providersWhat's more convenient than having access to your work apps on your personal device? Especially in healthcare,...
AD360 | October 29, 2025 Zoho Corp (ManageEngine) named a Major Player in the IDC MarketScape: Worldwide Integrated Solutions for Identity Security 2025 Vendor AssessmentToday's identity platforms sit at the intersection of governance, security, and business...
General | October 28, 2025Some old tech still beats the new stuffNew doesn't always mean better. New gadgets and new software updates are released all the...
Endpoint Central MSP | October 27, 2025Unify and conquer: Introducing the seamless integration of HaloPSA with Endpoint Central MSPIn the competitive landscape of MSPs, efficiency is the ultimate currency. Juggling...
General | October 24, 2025Top tips for smoother IT incident managementTop tips is a weekly column where we highlight what’s trending in the tech world and share...
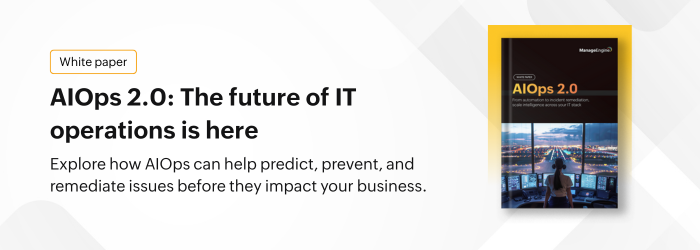
IT operations management and observability | October 22, 2025Learn to fix IT incidents in minutes, not hours with our AIOps white paperEvery IT team knows the pain of an outage alert that triggers a flood of noise, root cause...
General | October 17, 2025Oi London! ManageEngine is rolling into town with a brand new User ConferenceManageEngine is back in the United Kingdom with an all-new User Conference, this time in...